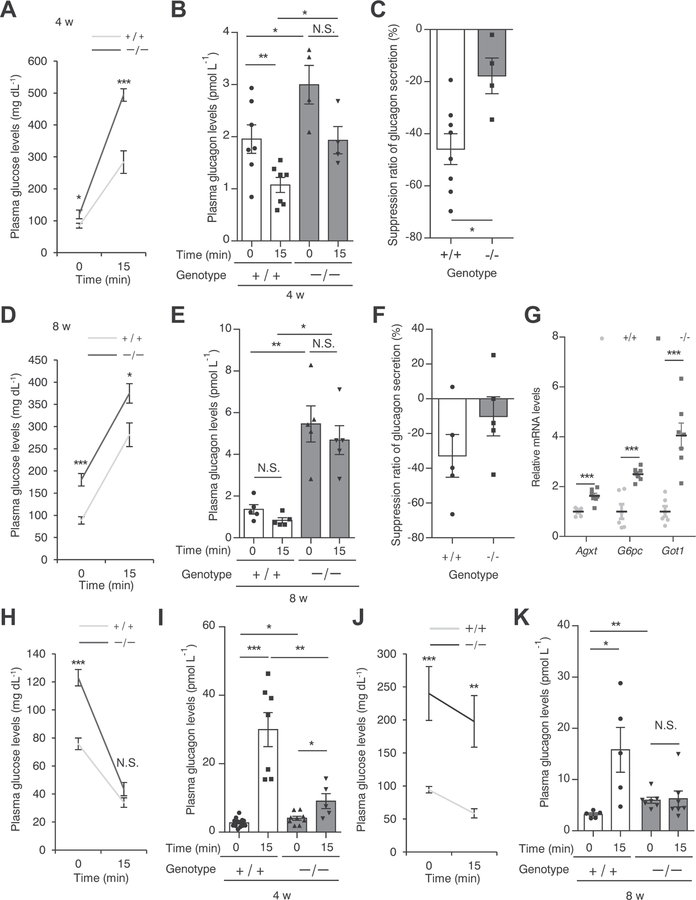
Fig. 4.
Dysregulated glucagon secretion in Hnf1a−/− mice (A–F). Plasma glucose levels (A, D) and plasma glucagon levels (B, E) before and at 15 min after glucose injection (3 g/kg) of 4- and 8-week-old Hnf1a+/+ (n = 5–7) and Hnf1a−/− (n = 4–5) mice. Suppression ratio of glucagon secretion (15 min after glucose injection vs. 0 min) in 4- and 8-week-old Hnf1a+/+ (n = 5–8) and Hnf1a−/− (n = 4–5) mice (C, F). (G) Hepatic gene expression of glucagon target genes in 8-week-old ad libitum-fed mice. The expression levels of Agxt, G6pc, and Got1 were normalized to that of 18S rRNA (n = 6–7). (H–K) Plasma glucose levels (H, J) and plasma glucagon levels (I, K) before and at 15 min after human insulin injection (2.0 U/kg) of 4-week-old mice (H, I) and 8-week-old mice (J, K) of both genotypes (n = 5–15). +/+ and −/− indicate Hnf1a+/+ and Hnf1a−/− mice, respectively. All data are presented as mean ± S.E. (S.E.; error bars). N.S., not significant; *p < 0.05; **p < 0.01; ***p < 0.001.

