
FIGURE 2.
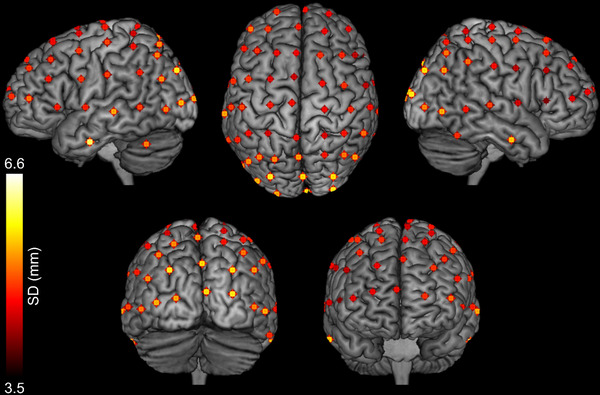
Mean projected cortex locations for each of 65 electrodes (including ground and reference) across 20 participants, displayed on an MNI template brain in MRICron. The standard deviation of each position is given by the color of the point, such that electrodes plotted in yellow had a higher standard deviation across participants than those plotted in red. For visualization purposes only, the mean co‐ordinate for each electrode was convolved with a 4 mm sphere