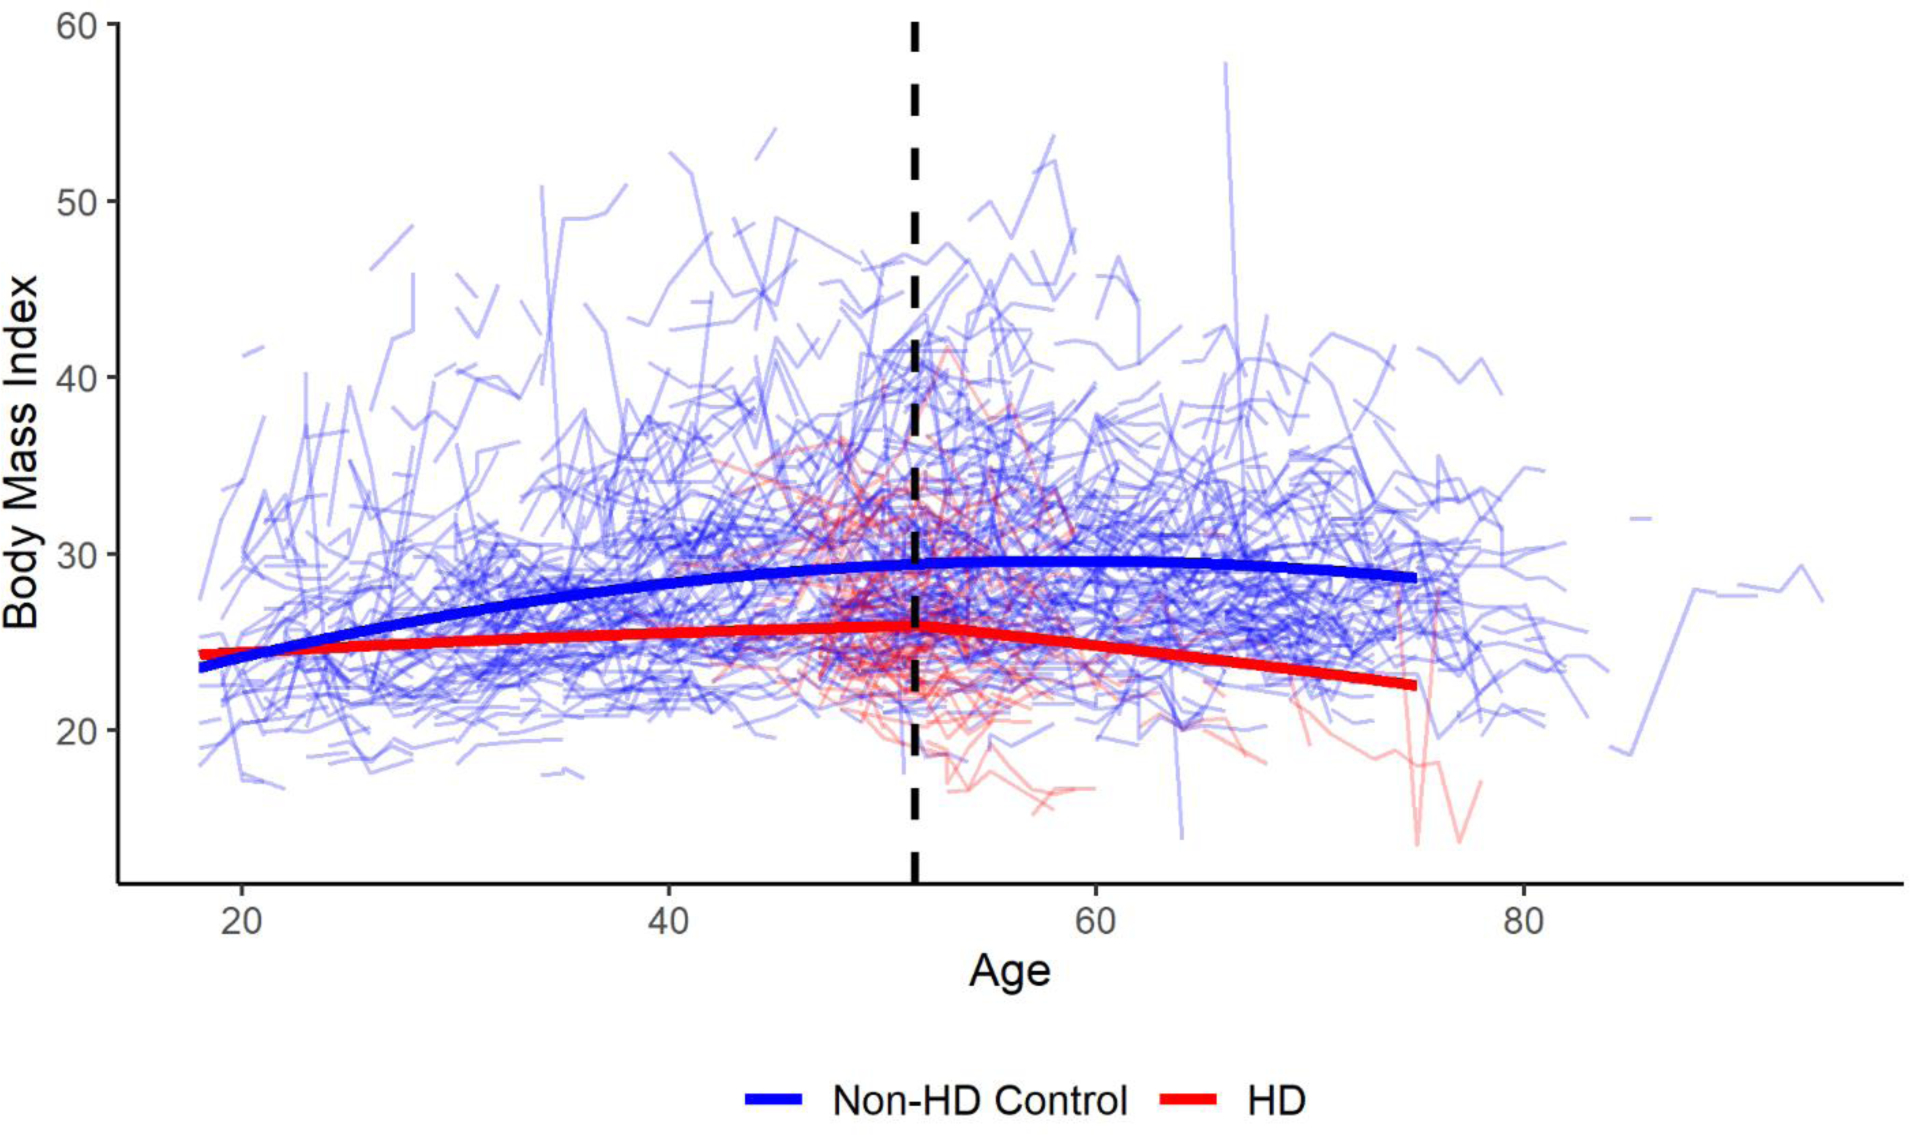
Figure 3: Trajectories of BMI Over Time using the Optimal Change Point Model.

Figure 3 presents a graph of the optimal change point model for male participants with HD and non-HD controls. Male HD participants had an age at motor onset of 46 years. Raw data are also plotted in the background and the change point is indicated with a dashed black line.
Abbreviations:
BMI: Body Mass Index
HD: Huntington’s disease
