Figure 2.

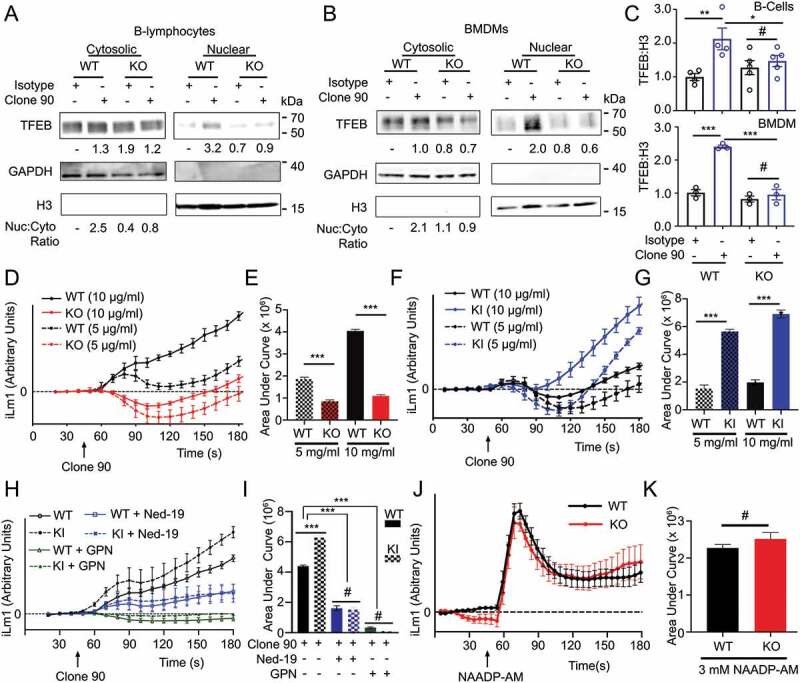
CD38 calcium signaling and nuclear localization of TFEB is dependent on LRRK2. Immunoblot of endogenous TFEB after nuclear fractionation of WT and lrrk2 KO (A) B-lymphocytes and (B) BMDMs treated with 5 µg/ml anti-CD38 antibody (clone 90) or an isotype control (Iso) for 1 h. (C) Quantification of western blots from A (upper, n = 4) and B (lower, n = 3). (D) Intracellular calcium response of purified WT (black) and lrrk2 KO (red) B-lymphocytes stimulated with anti-CD38 (clone 90, 5 and 10 µg/ml) antibody. (E) Quantification of calcium response (area under curve) from (D) to 5 min (n = 4). (F) Intracellular calcium response of purified WT (black) and LRRK2G2019S KI (blue) B-lymphocytes stimulated with anti-CD38 (clone 90, 5 and 10 µg/ml) antibody. (G) Quantification of calcium response from (F) to 5 min (n = 4). (H) Intracellular calcium response of purified WT (solid lines) or LRRK2G2019S KI (dashed lines) B-lymphocytes stimulated with anti-CD38 (clone 90 10 µg/ml, black) antibody with or without Ned-19 (100 µM, blue) or Gly-Phe-β-naphthylamide (200 µM, green). (I) Quantification of calcium responses (area under curve) from (H) to 5 min (n = 4). (J) Purified wild type (WT, black) or lrrk2 KO (KO, red) B-lymphocytes stimulated with NAADP-AM (3 µM). (K) Quantification of calcium responses (area under curve) from (H) to 5 min (n = 6). Partial calcium response curve is shown (to 3 min) as fluorescent counts (iLm1). For western data, histone H3 and GAPDH are shown as fractionation and loading controls. Western bands are quantified, normalized to the loading control, and presented relative to the control lane. (# – not significant; *p < 0.05; **p < 0.002, ***p < 0.0001, Student’s t-test or one-way ANOVA with post hoc Tukey’s HSD or Fisher’s LSD).
