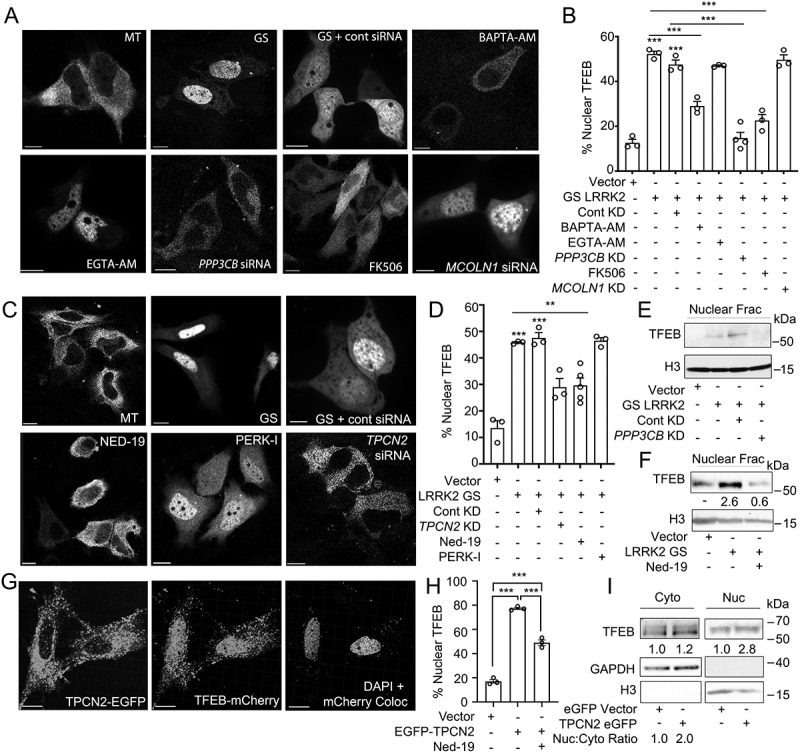
Figure 7.

LRRK2G2019S-mediated TFEB nuclear translocation requires Ca2+, NAADP, and TPCN2 (A) Confocal imaging in HeLa cells expressing TFEB-mCherry and a control vector (MT) or His-LRRK2G2019S with or without BAPTA-AM (fast calcium chelator, 10 μM, 1 h), EGTA-AM (slow calcium chelator, 10 μM, 1 h), FK506 (calcineurin inhibitor, 5 nM, 1 h), control siRNA, PPP3CB siRNA, or MCOLN1 siRNA. Scale bar: 10 μm. (B) Quantification TFEB nuclear translocation from (A) (n = 3, ≥ 50 cells/repeat). (C) Confocal imaging in HeLa cells expressing TFEB-mCherry and a control vector (MT), or TFEB-mCherry and His-LRRK2G2019S with or without Ned-19 (NAADP inhibitor, 100 μM, 1 h), PERK inhibitor (PERK-I, 10 μM, 1 h), control siRNA, or TPCN2 siRNA. Scale bar: 10 μm. (D) Quantification of TFEB nuclear translocation from (C) (n = 3, ≥ 50 cells/repeat). (E) Immunoblot of endogenous TFEB from nuclear fractions of HEK293T cells transfected with a control vector or His-LRRK2G2019S (GS) and either control siRNA or PPP3CB siRNA (PPP3CB KD). (F) Immunoblot of endogenous TFEB from nuclear fractions in HEK293T cells transfected with a control vector or His-LRRK2G2019S (GS) and treated with Ned-19 (100 μm, 2 h). (G) Confocal imaging in HeLa cells transfected with TFEB-mCherry and TPC2-EGFP. DAPI and TFEB-mCherry colocalization channel is shown on the right. Scale bar: 10 μm. (H) Quantification of % cells exhibiting TFEB nuclear translocation from (G) (n = 3, ≥ 50 cells/repeat). (I) Immunoblotting of endogenous TFEB following nuclear fractionation of HEK293T cells expressing TPCN2-EGFP. For western data, histone H3 and GAPDH are shown as fractionation and loading controls. Western bands are quantified, normalized to the loading control, and presented relative to control lane. (*p < 0.05; **p < 0.002, ***p < 0.0001, one-way ANOVA with post hoc Tukey’s HSD).
