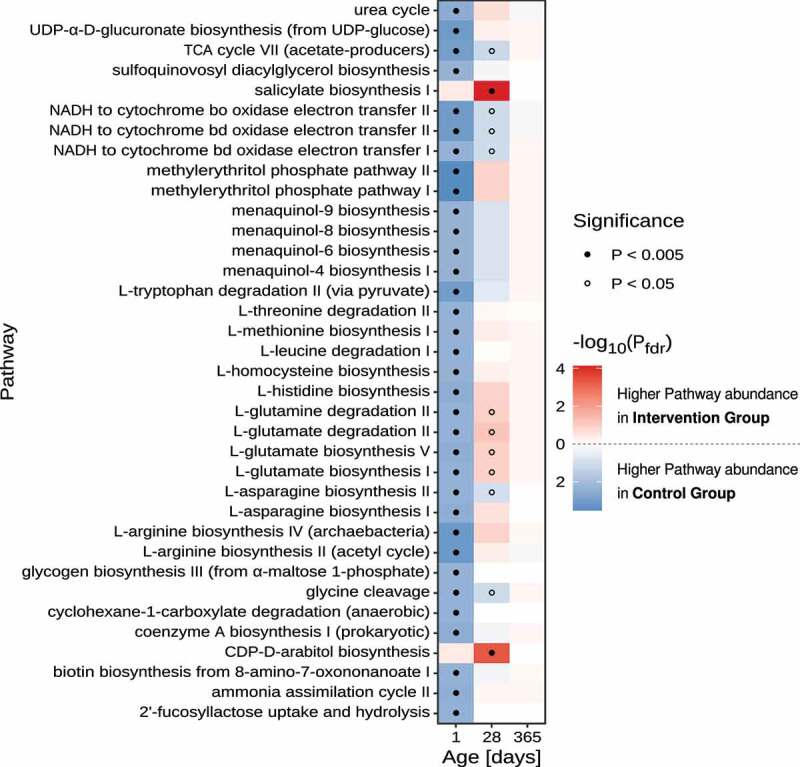
Figure 4.

Differential pathway abundance analyses between control- and intervention group stool samples. Heatmap of FDR-adjusted P-values refer to the significance levels obtained by comparing the sum of OTU-counts between samples from the control- and intervention group for OTUs that were predicted to harbor the focal metabolic pathway. Only pathways with an FDR-adjusted P-value < 0.005 in at least one of the age groups are displayed. Dots indicate pathways with P-values below 0.005 (filled circle) and 0.05 (open circles), respectively. Statistical comparison of pathway abundance is based on a zero-inflated beta-binomial (ZIBB) model to account for excessive zeroes and over-dispersion in the sequence count data.37
