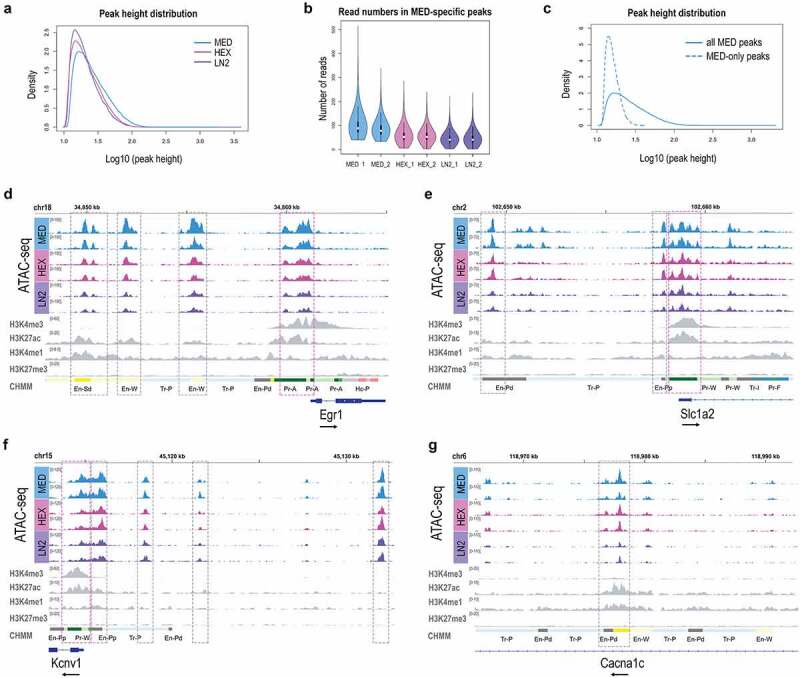
Figure 2.

Chromatin signatures in neuronal cells of the mouse brain. ATAC-seq peak height (a) and Read number in MED-specific peaks (b) for MED, HEX, and LN2 condition. c. Average peak height in all MED peaks vs. MED-only peaks. Chromatin accessibility (ATAC-seq) profiles of Egr1 (d), Slc1a2 (e), Kcnv1 (f), and Cacna1c (g) in mouse cortical neuronal cells, shown in duplicates for each condition. Histone modification ChIP-seq tracks (H3K4me3, H3K27ac, H3K4me1, H3K27me3) for all four genes are derived from postnatal 0 day mouse forebrain bulk tissue, generated by the Mouse ENCODE project. MED neuronal nuclei, blue; HEX neuronal nuclei, pink; LN2 neuronal nuclei, purple; ENCODE bulk brain tissue, grey. Note: grey dashed boxes show putative enhancers and purple dashed boxes show promoters. The black arrow by each gene signifies the direction of transcription.
