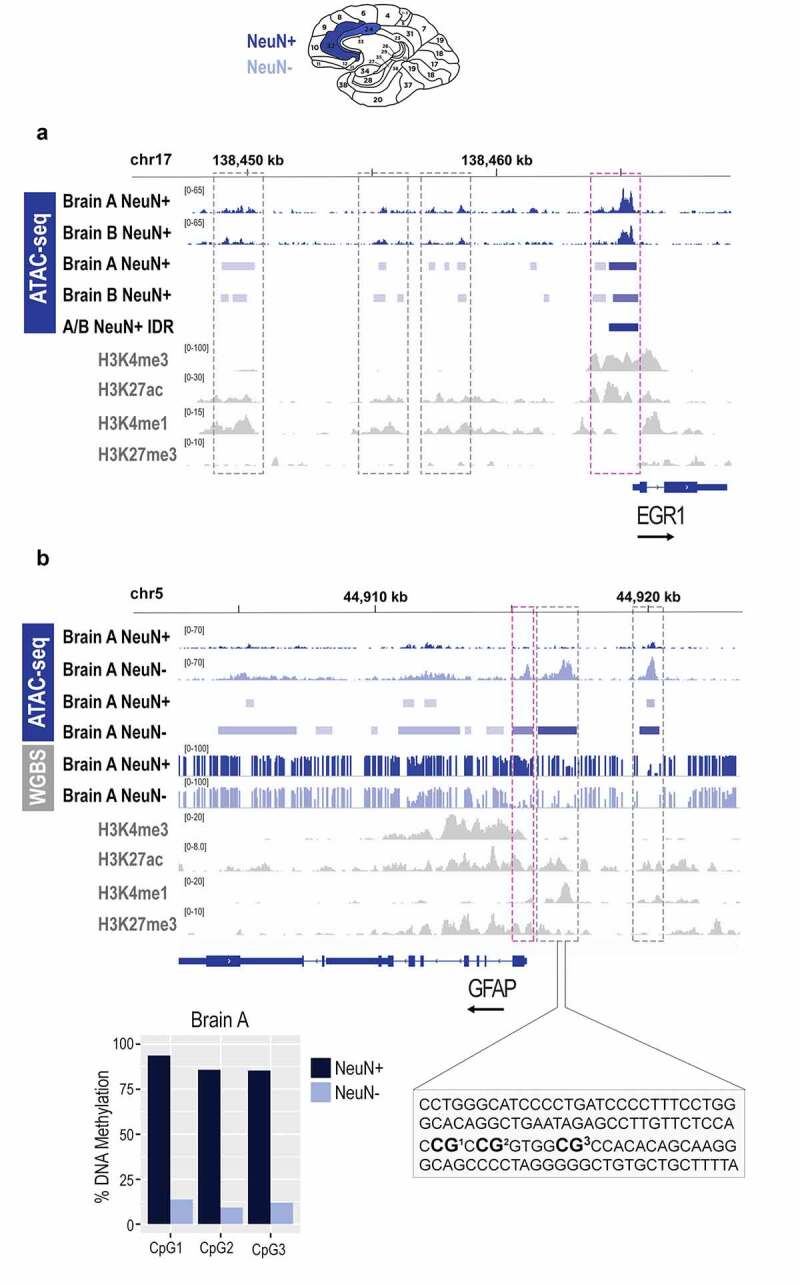
Figure 6.

Epigenomic signatures of neuronal and non-neuronal cells in post-mortem human brain. a. Chromatin accessibility (ATAC-seq) profile of the EGR1 gene in neuronal (NeuN+) cells of the post-mortem human anterior cingulate cortex; bam and bed files are shown for each brain separately (a and b); the A/B IDR track represents a bed file of high confidence peaks generated by the IDR analysis. b. Chromatin accessibility (ATAC-seq) and DNA methylation (WGBS) profile of the GFAP gene in neuronal (NeuN+) and non-neuronal (NeuN-) cells of the post-mortem human anterior cingulate cortex; bam, bed, and bedgraph files are shown for both cell types; shown is also a focused DNA methylation analysis of the three CpG sites (bar graph) located in the proximal enhancer (dashed rectangle) using bisulphite pyrosequencing. Histone modification ChIP-seq tracks (H3K4me3, H3K27ac, H3K4me1, H3K27me3) for both genes are derived from the cingulate gyrus bulk tissue, generated by the NIH Roadmap Epigenomics project. Neuronal (NeuN+) nuclei, dark blue; Non-neuronal (NeuN-) nuclei, light blue; NIH Roadmap Epigenomics bulk brain tissue, grey. Note: grey dashed boxes show putative enhancers and purple dashed boxes show promoters. The black arrow by each gene signifies the direction of transcription.
