Figure 3.

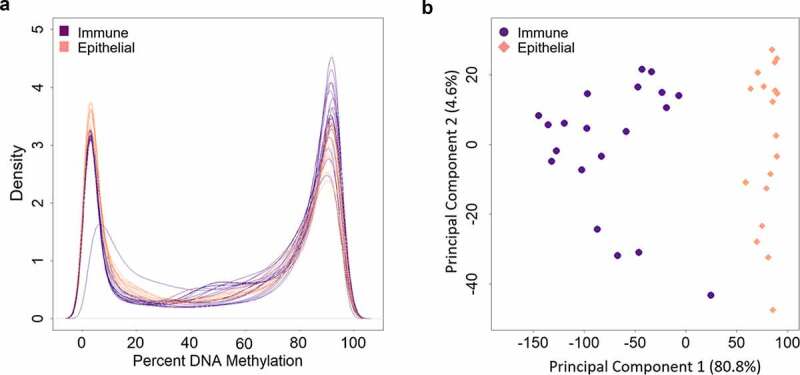
Density plot and principal component analysis of DNA methylation measures painted cell types. A) Density plots of DNA methylation of all CpG sites, displaying DNA methylation distributions by cell type (immune cells in purple and epithelial cells in pink). Each line represents one cell fraction. Beta values were converted to percentages. B) DNA methylation principal components one and two, colored by immune cells in purple and epithelial cells in pink. Principal component 1 explained 80.8% of the variance in the DNA methylation data. Principal component 2 explained 4.6% of the variance in the DNA methylation data.
