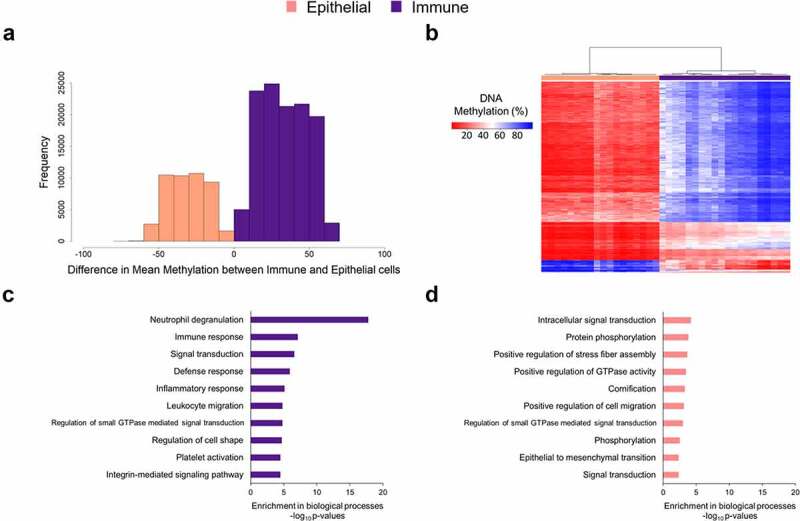
Figure 4.

DNA methylation differences between immune and epithelial cell types. (a) Among DNA methylation sites differentially methylated between immune and epithelial cells (p < 10−8, 164,793 sites), histogram of the magnitude of DNA methylation difference. The x-axis is percent methylation, and the reference group was epithelial cells. The values were calculated as percent methylation of immune minus that of epithelial. (b) The top 500 most differentially methylated sites between immune and epithelial cells by p-value (t-test) are plotted in heatmap rows (red indicates lower DNA methylation, blue indicates higher DNA methylation). In heatmap columns, unbiased hierarchical clustering of samples was performed (immune fractions in purple and epithelial fractions in pink). (c) Bar chart of the gene ontology biological processes enriched (minimum p < 3.2 × 10⁻⁵) among genes hypomethylated in immune cells, relative to epithelial cells. (d) Bar chart of the gene ontology biological processes enriched (minimum p < 4.7 × 10⁻³) among genes hypomethylated in epithelial cells, relative to immune cells.
