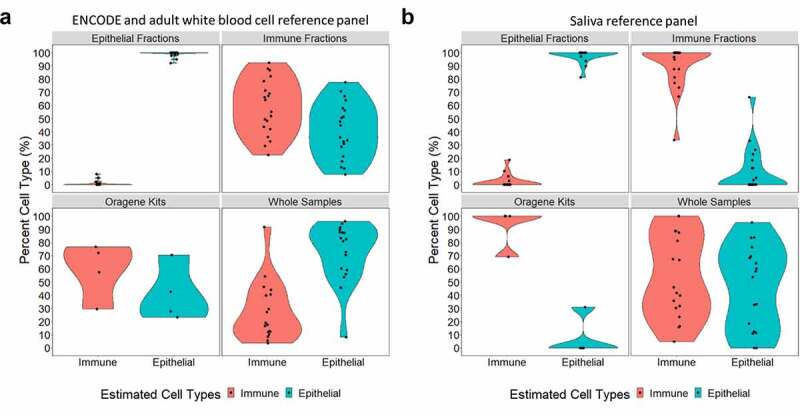
Figure 5.

Cell-type percentages estimated in saliva samples from DNA methylation data, using two estimation methods. Violin plots are used to visualize the percent immune cells estimated in red and the percent epithelial cells estimated in blue. In both panels A and B, the upper left quadrant shows the percent cell types estimated in sorted epithelial samples (n = 18); the upper right quadrant shows the percent cell types estimated in sorted immune cell samples (n = 20), the lower left quadrant shows the percent cell types estimated in whole saliva collected in Oragene kits (n = 4); and the lower right quadrant shows the percent cell types estimated in whole saliva samples collected directly (n = 18). (a) Percent cell types were estimated using a reference panel generated from ENCODE epithelial cell DNA methylation data [29,31] and an adult white blood cell data[30], implemented through ewastools. (b) Percent cell types estimated using our new primary saliva reference panel implemented through ewastools[23].
