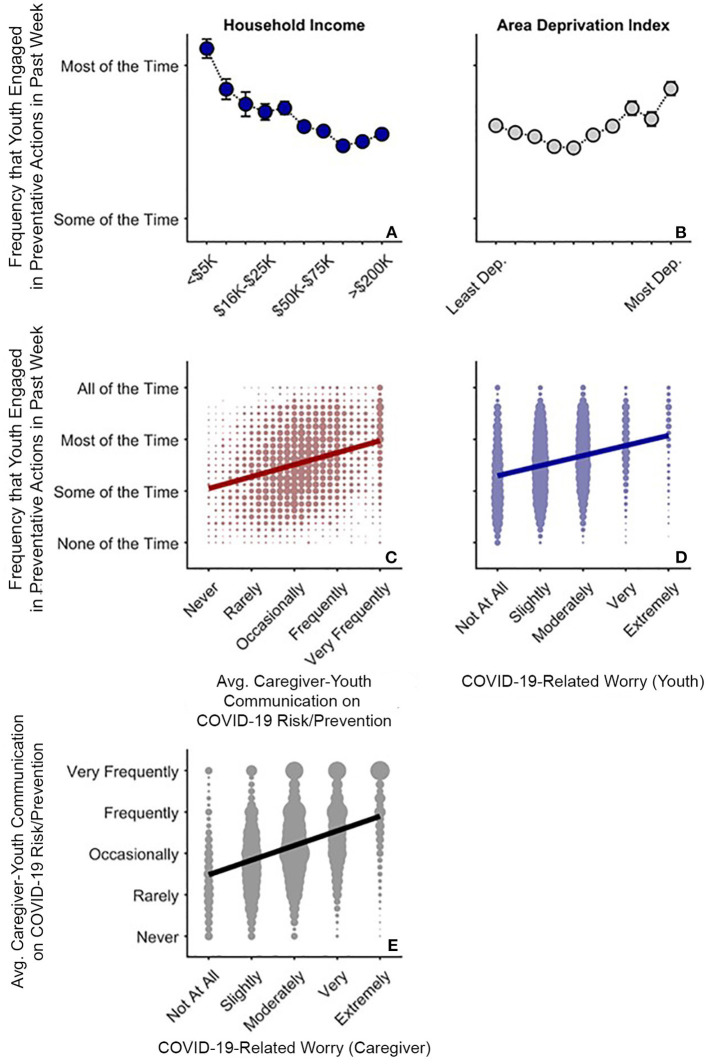
Figure 6.
COVID-19 risk and prevention as functions of COVID-19-related worry in caregivers and youth. (A,B) Average (Avg.) frequency that youth endorsed COVID-19-related preventative behaviors as functions of annual household income and area deprivation index. Error bars are ±1 between-subjects standard error of the means. Analysis controlled for caregiver education, child race, ethnicity, sex, and age, questionnaire number, participants' baseline study site, and participant. Area deprivation index was collapsed across continuous deciles for graphing. (C) Frequency of youths' preventative behaviors by caregiver-youth risk/prevention communication frequency (i.e., averaged data from Figure 4). (D) Frequency of youths' preventative behaviors by youth COVID-19-related worry. (E) Frequency of caregiver-child risk/prevention communication by caregiver COVID-19-related worry. (C–E) Circle size reflects the number of datapoints at each x-y coordinate. Solid lines are best fitting simple regression lines.

