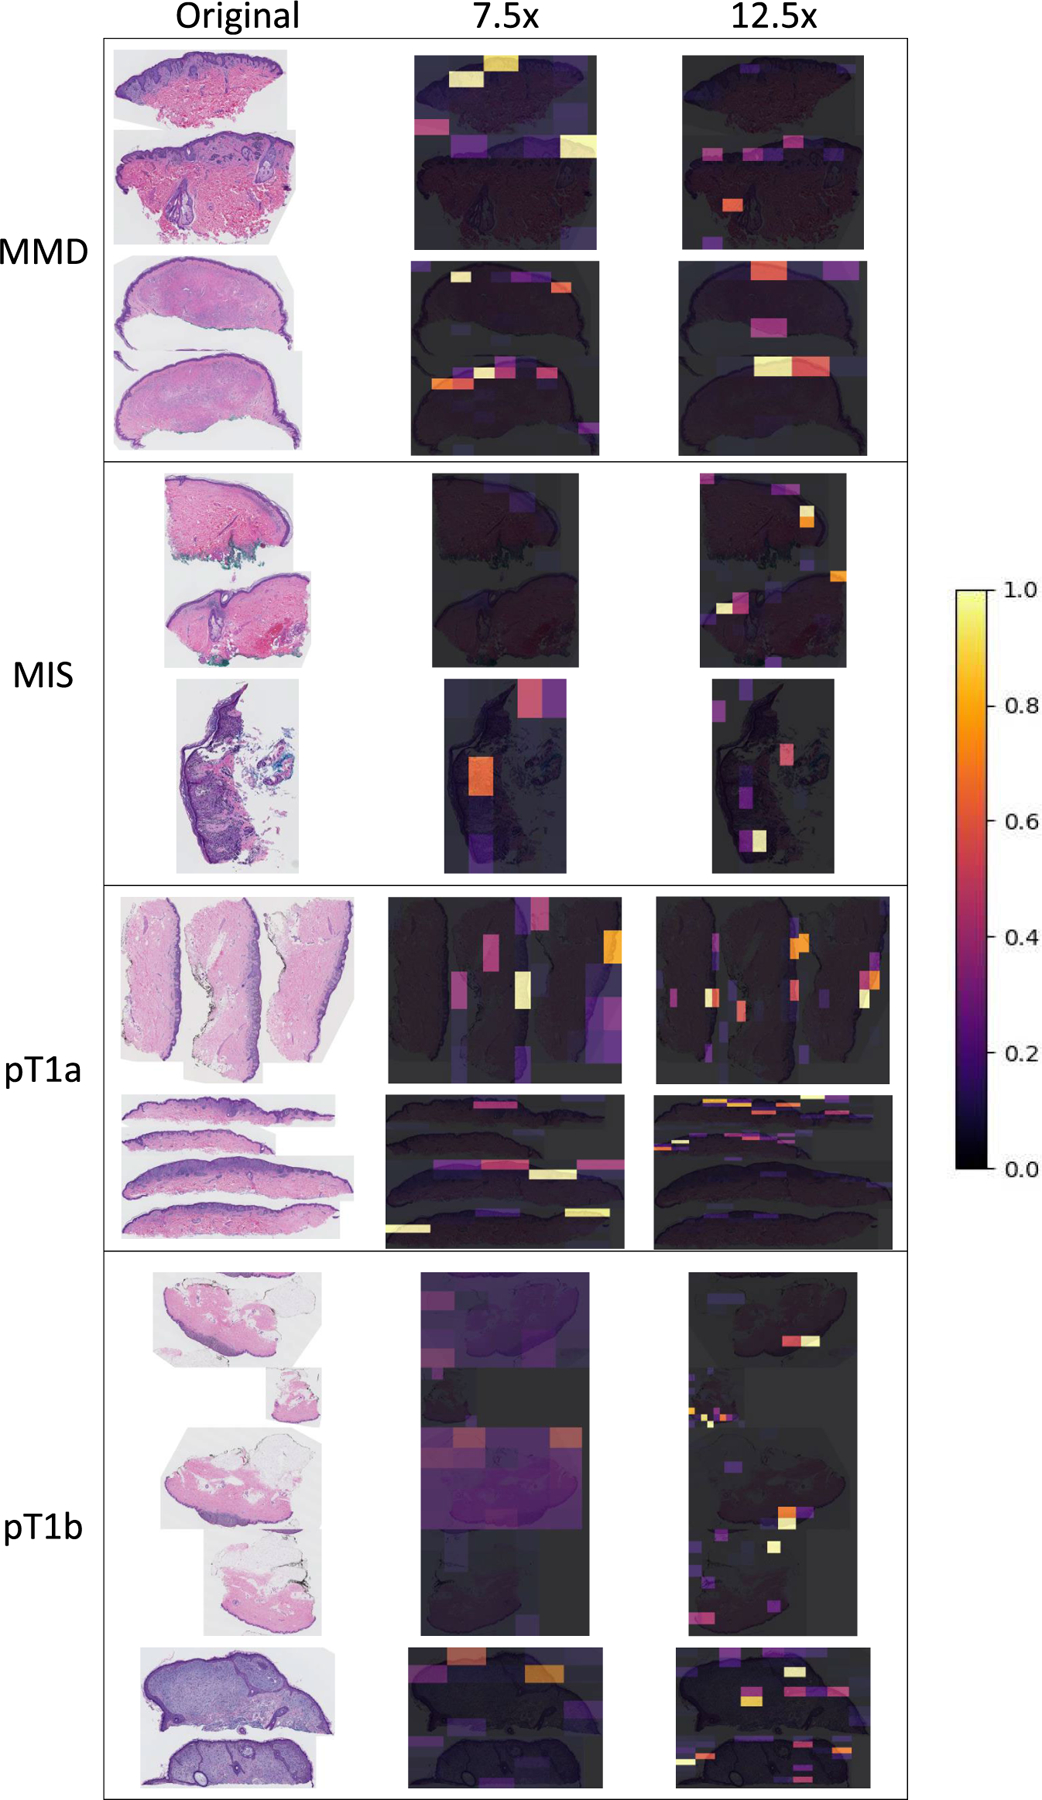
FIGURE 8.

Visualization of gradient in ScATNet. The left column shows original whole slide images in all diagnostic categories: mild and moderate dysplastic nevi (MMD), melanoma in situ (MIS), invasive melanoma stage pT1a (pT1a), invasive melanoma stage ≥pT1b (pT1b). The right two columns are the corresponding gradient maps calculated from 7.5x and 12.5x input scales. All examples shown were correctly classified into their diagnostic categories. Colors from purple to yellow are assigned to values between 0 and 1.
