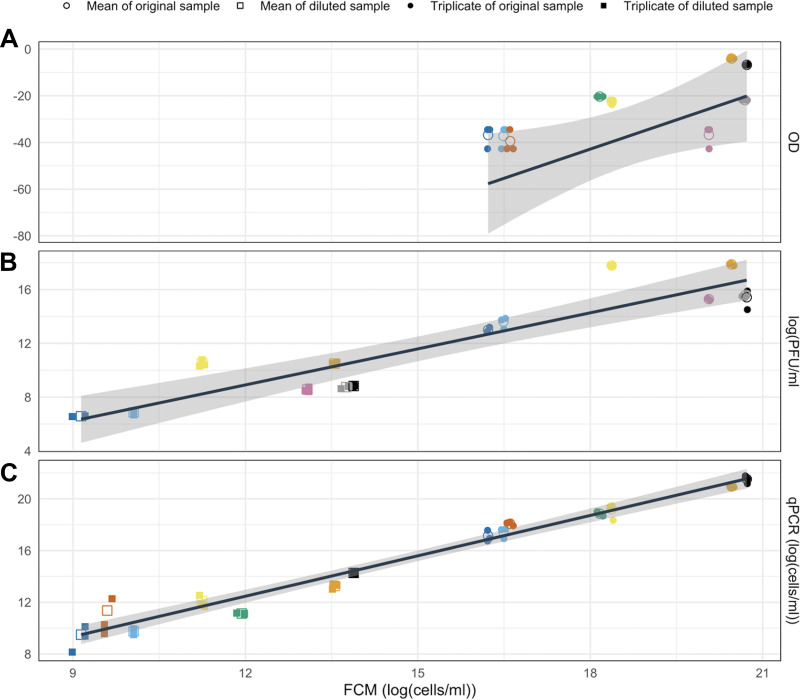
FIG 1.
Linear regression plot with confidence intervals (gray) to compare quantification when using flow cytometry (log[cells/mL] with other methods): (A) Optical density (Box-Cox transformation, lambda = −0.6). Each bold point represents the mean of three observations. Pearson’s correlation coefficient: 0.784. P value < 0.05. Box-Cox transformed OD = −192.967 + logFCM*8.339. R2 = 0.456. (B) PFU method (log[PFU/mL]). Each bold point represents the mean of three observations. Pearson’s correlation coefficient: 0.923. P value < 0.0001. Log(PFU) = −1.821 + log(FCM0.894). R2 = 0.84. (C) qPCR (log(cells/mL) Each bold point represents the mean of three observations). Pearson’s correlation coefficient: 0.987. P value < 0.0001. Log(qPCR) = −0.023 + logFCM1.041. R2 = 0.972.

