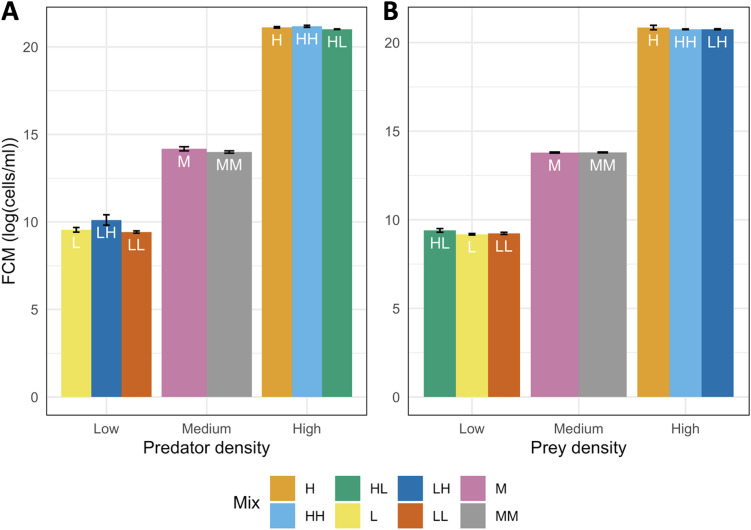
FIG 3.
FCM count (log[cells/mL]) of the (A) Bdellovibrio predator and (B) the Pseudomonas prey at different densities (low, medium, and high) and different mix conditions: (L) monoculture of low density, (M) monoculture of medium density, (H) monoculture of high density, (LL) low predator: low prey densities, (LH) low predator: high prey densities, (HL) high predator: low prey densities, (HH) high predator: high prey densities and (MM) medium predator: medium prey densities.

