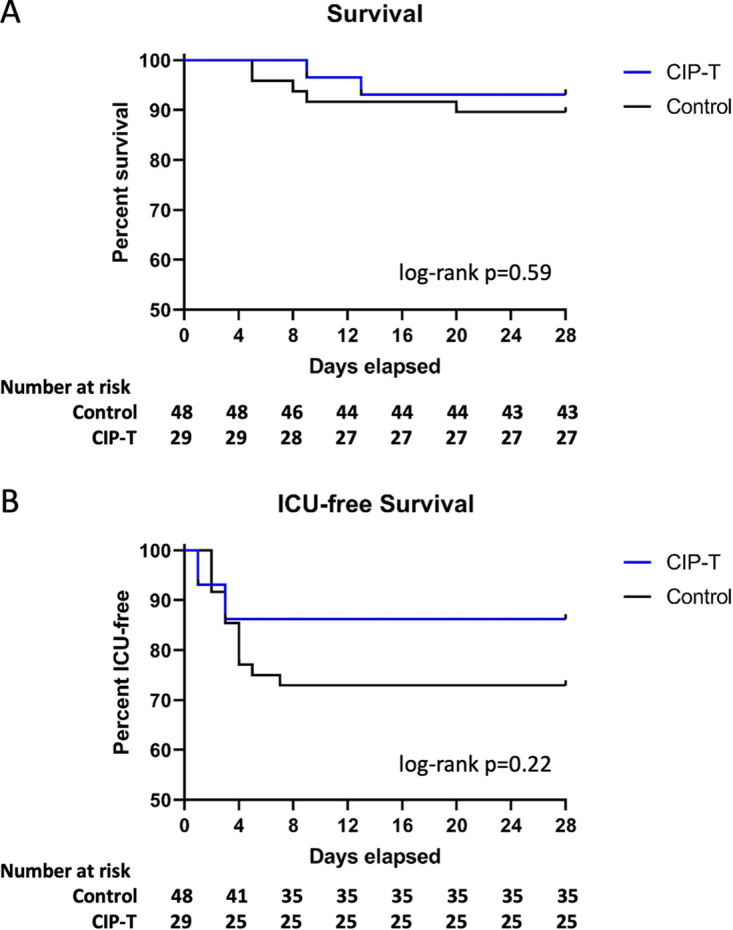
FIG 2.

Effect of CIP on progression to critical illness and survival. Kaplan-Meier curves are shown comparing survival (A) and ICU-free survival (B) in CIP transfused patients vs control. Number of patients remaining at risk are listed along the bottom of each panel. Log-rank P values are listed.
