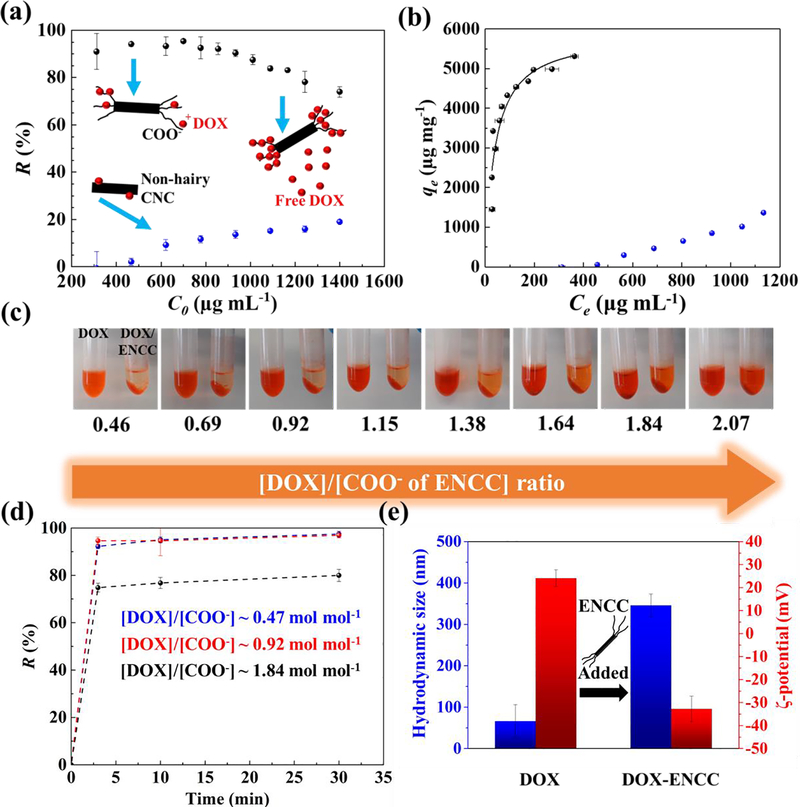
Fig. 2. Drug capture in aqueous media.
(a) DOX removal R = (C0 − Ce)/C0 by ENCC or CNC in DPBS versus initial DOX concentration C0, obtained from measuring the equilibrium DOX concentration Ce using a microvolume UV-vis spectrophotometer. (b) DOX capture capacity of ENCC (black symbols) or CNC (blue symbols) defined as qe = (C0 − Ce) V/mENCC versus equilibrium DOX concentration Ce and the corresponding Langmuir fit (curve). Sample volume V ~ 500 μL. The DOX removal capacity of ENCC in DPBS is >5200 μg mg−1, and CNC is unable to effectively capture DOX due to the lack of high-density anionic groups. The background error is corrected. (c) Optical images of DOX solutions with concentrations ranging from ~ 300 μg mL−1 to ~1400 μg mL−1 before and after the addition of ENCC with a final concentration ~ 195 μg mL−1. This wide range of concentrations corresponds to a broad ratio of DOX to the carboxylate content of ENCC (~ 0.46–2.07). (d) Time-dependent DOX capture using ENCC, showing an extremely fast drug removal taking place almost immediately after ENCC-DOX contact. Here, DOX concentration [DOX] ~ 311, 622, and 1244 μg mL−1, and ENCC concentration [ENCC] ~ 195 μg mL−1, and the ratio of DOX to the COO− of ENCC ~ 0.47, 0.92, 1.82 mol mol−1. (e) Colloidal properties of DOX significantly change upon adsorption onto ENCC. Hydrodynamic size of DOX aggregates ~ 66 nm increases to ~ 350 nm, an indication of ENCC-mediated aggregation. The ζ-potential of colloidal DOX changes from ~ +24 mV to ~ −32 mV as a result of adsorption to the negatively-charged ENCC. Note that [DOX]/[COO−] ~ 0.1, therefore ENCC (concentration ~ 100 μg mL−1) is not saturated, forming stable colloidal aggregates.

