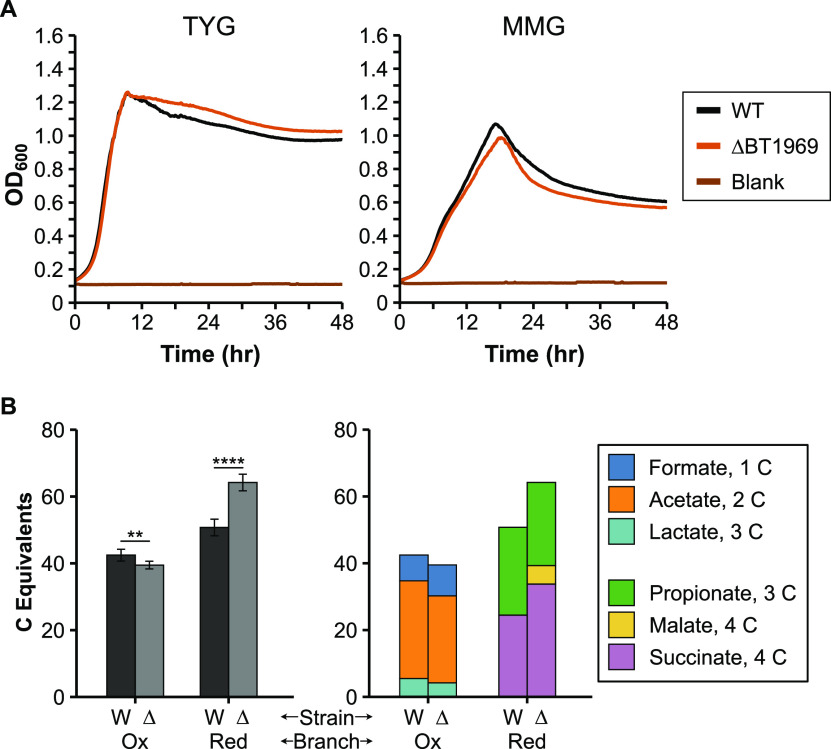
FIG 6.
Characterization of growth and oxidative versus reductive branch metabolite production in the wild-type (WT) and ΔBT1969 strains. A) Representative growth curves of WT and ΔBT1969 strain in either rich medium (TYG, left panel), or defined minimal medium with glucose (MMG, right panel). OD600: optical density at 600 nm. Average growth rate data can be found in Table S3 in the supplemental material. B) Oxidative branch metabolites (pyruvate, formate, lactate, and acetate) and reductive branch metabolites (malate, succinate, and propionate) were quantified by HPLC with culture supernatants from the two strains grown in minimal medium with glucose (n = 6 each). Concentrations of each OA were multiplied by the number of carbon (C) atoms per molecule to calculate “C equivalents.” Oxidative and reductive branch C equivalents were separately pooled for comparison. The left panel shows metabolites pooled by branch. Error bars show standard deviation. Samples were compared using the Welch two-sample t test. **, P < 0.01. ****, P < 0.0001. The right panel shows C equivalents for individual OAs. W: wild type; Δ: ΔBT1969; Ox: oxidative branch; Red: reductive branch. Individual OA concentrations and standard deviations are shown in Table S5.

