FIG 7.
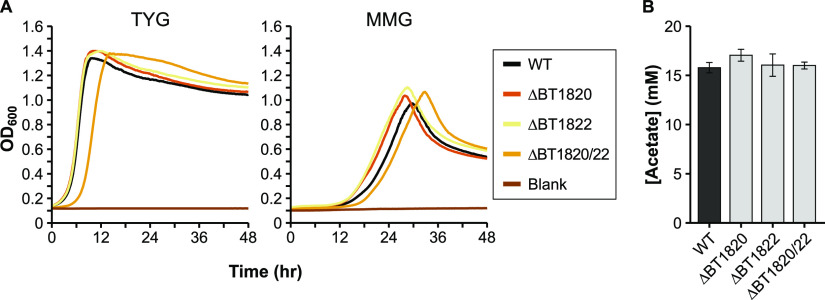
Characterization of potential acetate production deletion mutants. A) Representative growth curves of the wild-type (WT) and mutant strains in either rich medium (TYG, left panel), or defined minimal medium with glucose (MMG, right panel). OD600: optical density at 600 nm. Average growth rate data can be found in Table S3 in the supplemental material. B) HPLC quantification of acetate in culture supernatant from the WT strain and in various single or double mutants (n = 3 each) grown in minimal medium with glucose. Error bars in panel B show standard deviation.

