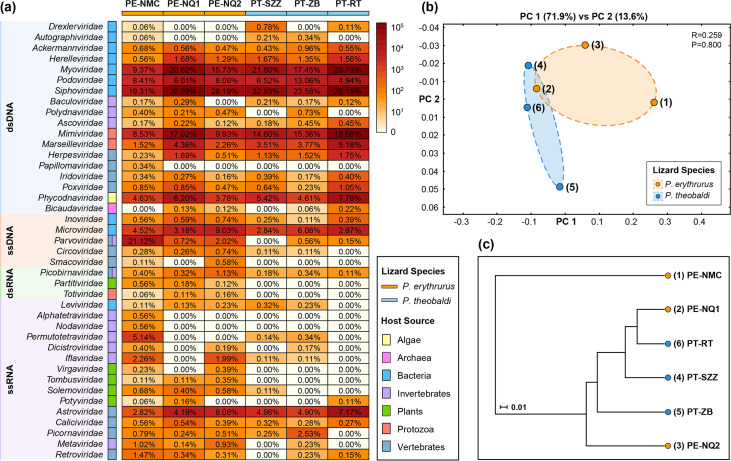
FIG 2.
Viral taxonomy analyses at the family level. (a) Heatmap representing the read number of each viral family in exponential form. Host sources and lizard species are indicated with the color coding shown in the key. Viral genome composition is represented by different-colored rectangles, with taxon names indicated on the left. The percentages of each viral family in the six viromes are shown. The sample names are defined in the form of lizard species-sampling site. PE, Phrynocephalus erythrurus; PT, Phrynocephalus theobaldi; NMC, Namtso, NQ, Naqu; SZZ, Sangzhuzi; ZB, Zhongba; RT, Rutog. (b, c) PCoA plot (b) and UPGMA taxonomic tree (c) showing the similarity of viral community structures based on the Bray-Curtis ecological distance matrix. The P value was calculated using ANOSIM.

