FIG 3.
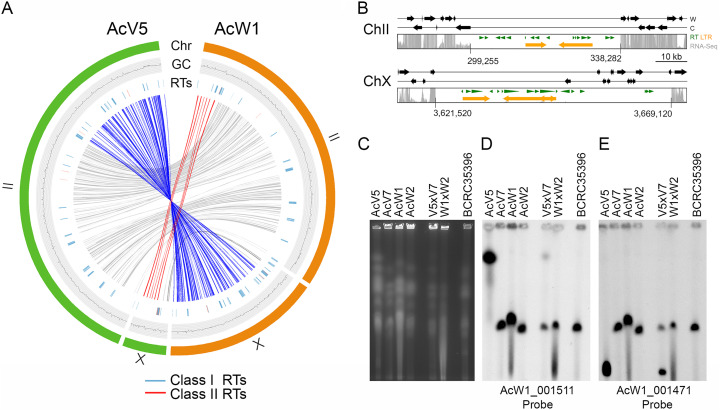
Chromosomal translocations in V5. (A) Collinearity relationships are depicted in red, blue, or gray in the inner circle, respectively. The outer circles represent W1-ChII and W1-ChX (in orange), as well as V5-ChII and V5-ChX (in green). The GC contents (window size 5,000 bp) of the two chromosomes are shown in the middle traces. Class I RTs (in blue) and class II RT (in red) are shown in the inner traces. (B) Schematic illustrating the putative centromeric regions on V5-ChII and V5-ChX. The gray bars indicate RNA-seq read depth. RTs predicted by the RepeatMasker search program (http://www.repeatmasker.org/) (8) and the LTR-finder program (http://tlife.fudan.edu.cn/tlife/ltr_finder/) (12) are indicated in green and orange, respectively. The locations of two V5 centromeres are indicated. (C) PFGE was applied to separate the chromosomes of V5, V7, W1, W2, V5×V7, W1×W2, and BCRC35396. (D to E) Southern hybridization with two DNA probes, as indicated. These results provide additional evidence of our high-quality genome assembly for W1 and V5.

