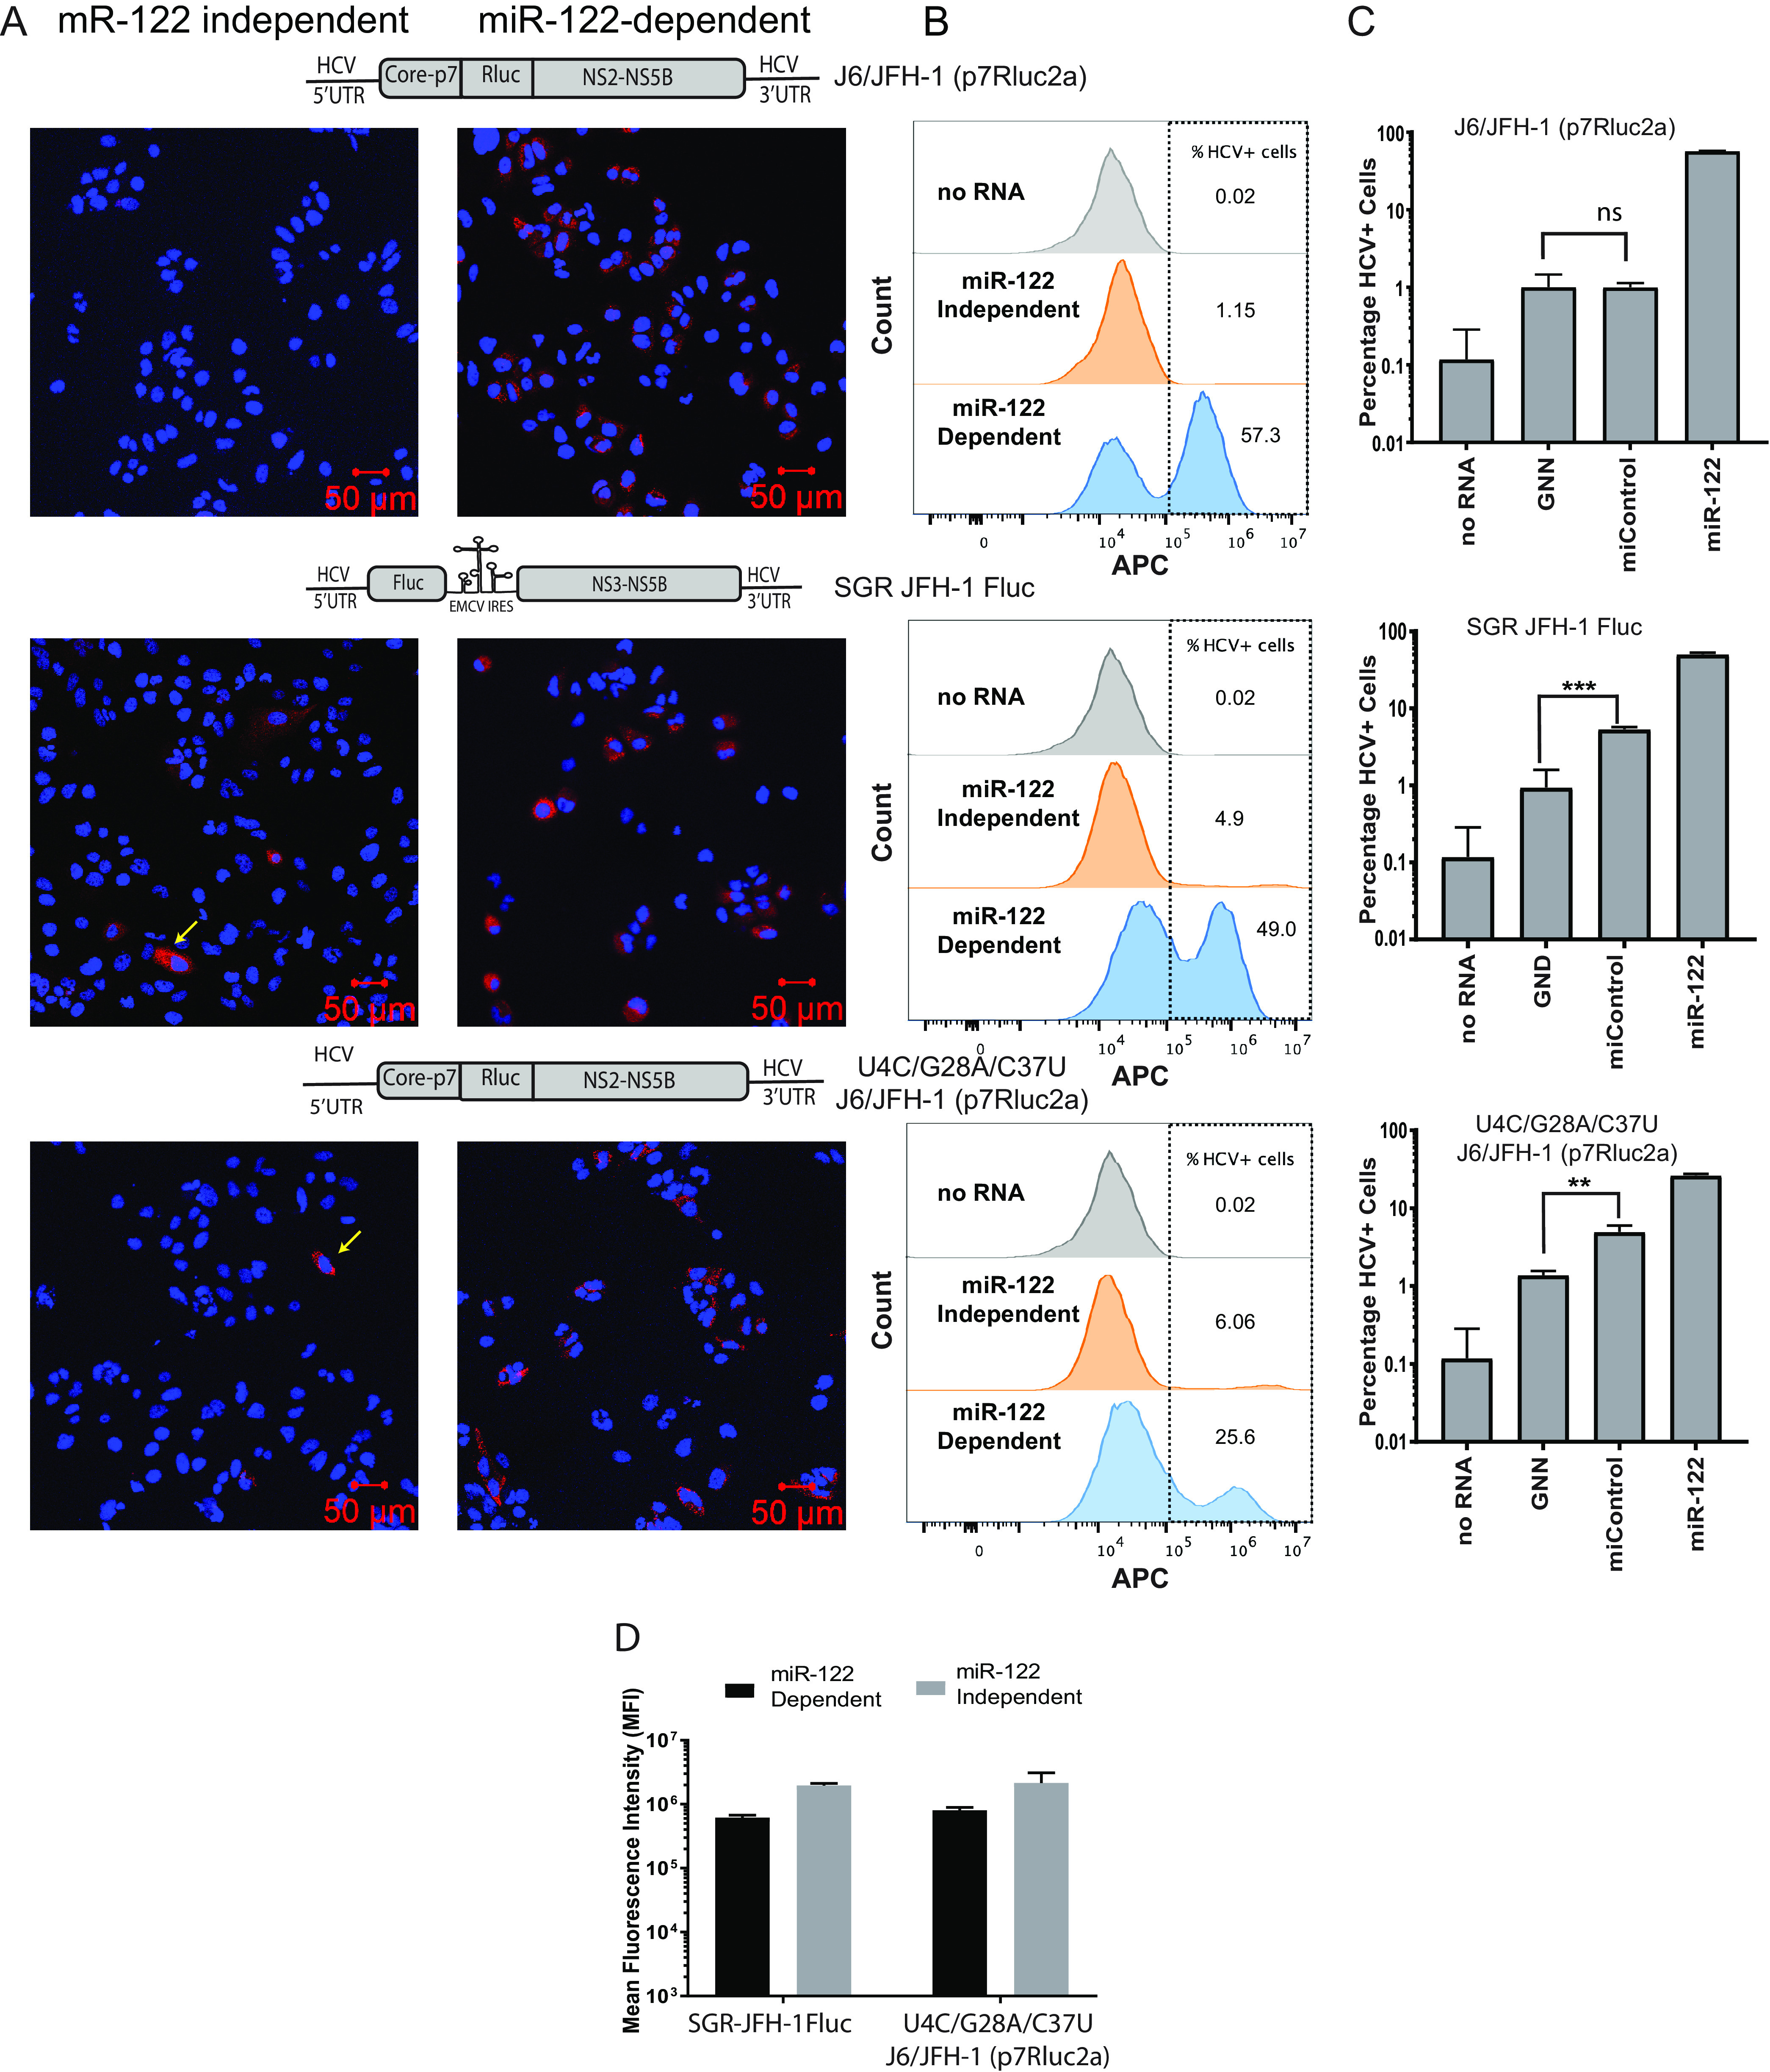
FIG 5.

miR-122-independent replication is supported by a few cells within the population. (A) Immunostaining and confocal microscopy of Huh 7.5 miR-122 knockout cells coelectroporated with wild-type J6/JFH-1 (p7Rluc2a), SGR JFH-1 Fluc, and U4C/G28A/C37U J6/JFH-1 (p7Rluc2a) HCV RNA with control microRNA (miControl, left panel) or miR-122 (right panel). Cells were coelectroporated with viral RNA and microRNA and immunostained to detect NS5a on day 3. HCV NS5a is stained red with Alexa Fluor-594 secondary antibody, and the cells were counterstained with DAPI to identify the nucleus. The RNA constructs are shown above the panel. Cells supporting miR-122-independent replication are indicated with yellow arrows. (B) Representative flow cytometry plots of Huh 7.5 miR-122 KO cells coelectroporated with J6/JFH-1 (p7Rluc2a), SGR JFH-1 Fluc, or U4C/G28A/C37U J6/JFH-1(p7Rluc2a) HCV RNA and control microRNA or miR-122. Cells were collected on day 3 postelectroporation, stained for HCV NS5a with 9E10 anti-NS5a and APC-conjugated goat anti-mouse secondary antibody. The y axis indicates the count of the cells, and the x axis indicates the intensity of the APC signal. Data are represented as a histogram overlay of no RNA and miR-122-independent and miR-122-dependent replication. Gray histogram indicates the “no-RNA” control, whereas orange and blue histograms indicate the miR-122-independent and miR-122-dependent replication. The no-RNA control was used to gate HCV-positive cells. (C) Percentage of Huh 7.5 miR-122 KO HCV-positive cells electroporated with viral RNAs indicated (wild-type J6/JFH-1 [p7Rluc2a], SGR JFH-1 Fluc, or U4C/G28A/C37U J6/JFH-1 [p7Rluc2a]) and control microRNA or miR-122. Cells electroporated with no RNA and GNN are used as negative controls. (D) The mean fluorescence intensity (MFI) of cells supporting HCV replication (panel B) was calculated with FlowJo software v10.6. The MFI was measured as a proxy for viral NS5a protein accumulation in the cells. All data shown are the average of three or more independent experiments. Error bars indicate the standard deviation of the mean, and asterisks indicate significant differences. The significance was determined by using Student’s t test (**, P < 0.002; ***, P < 0.001).
