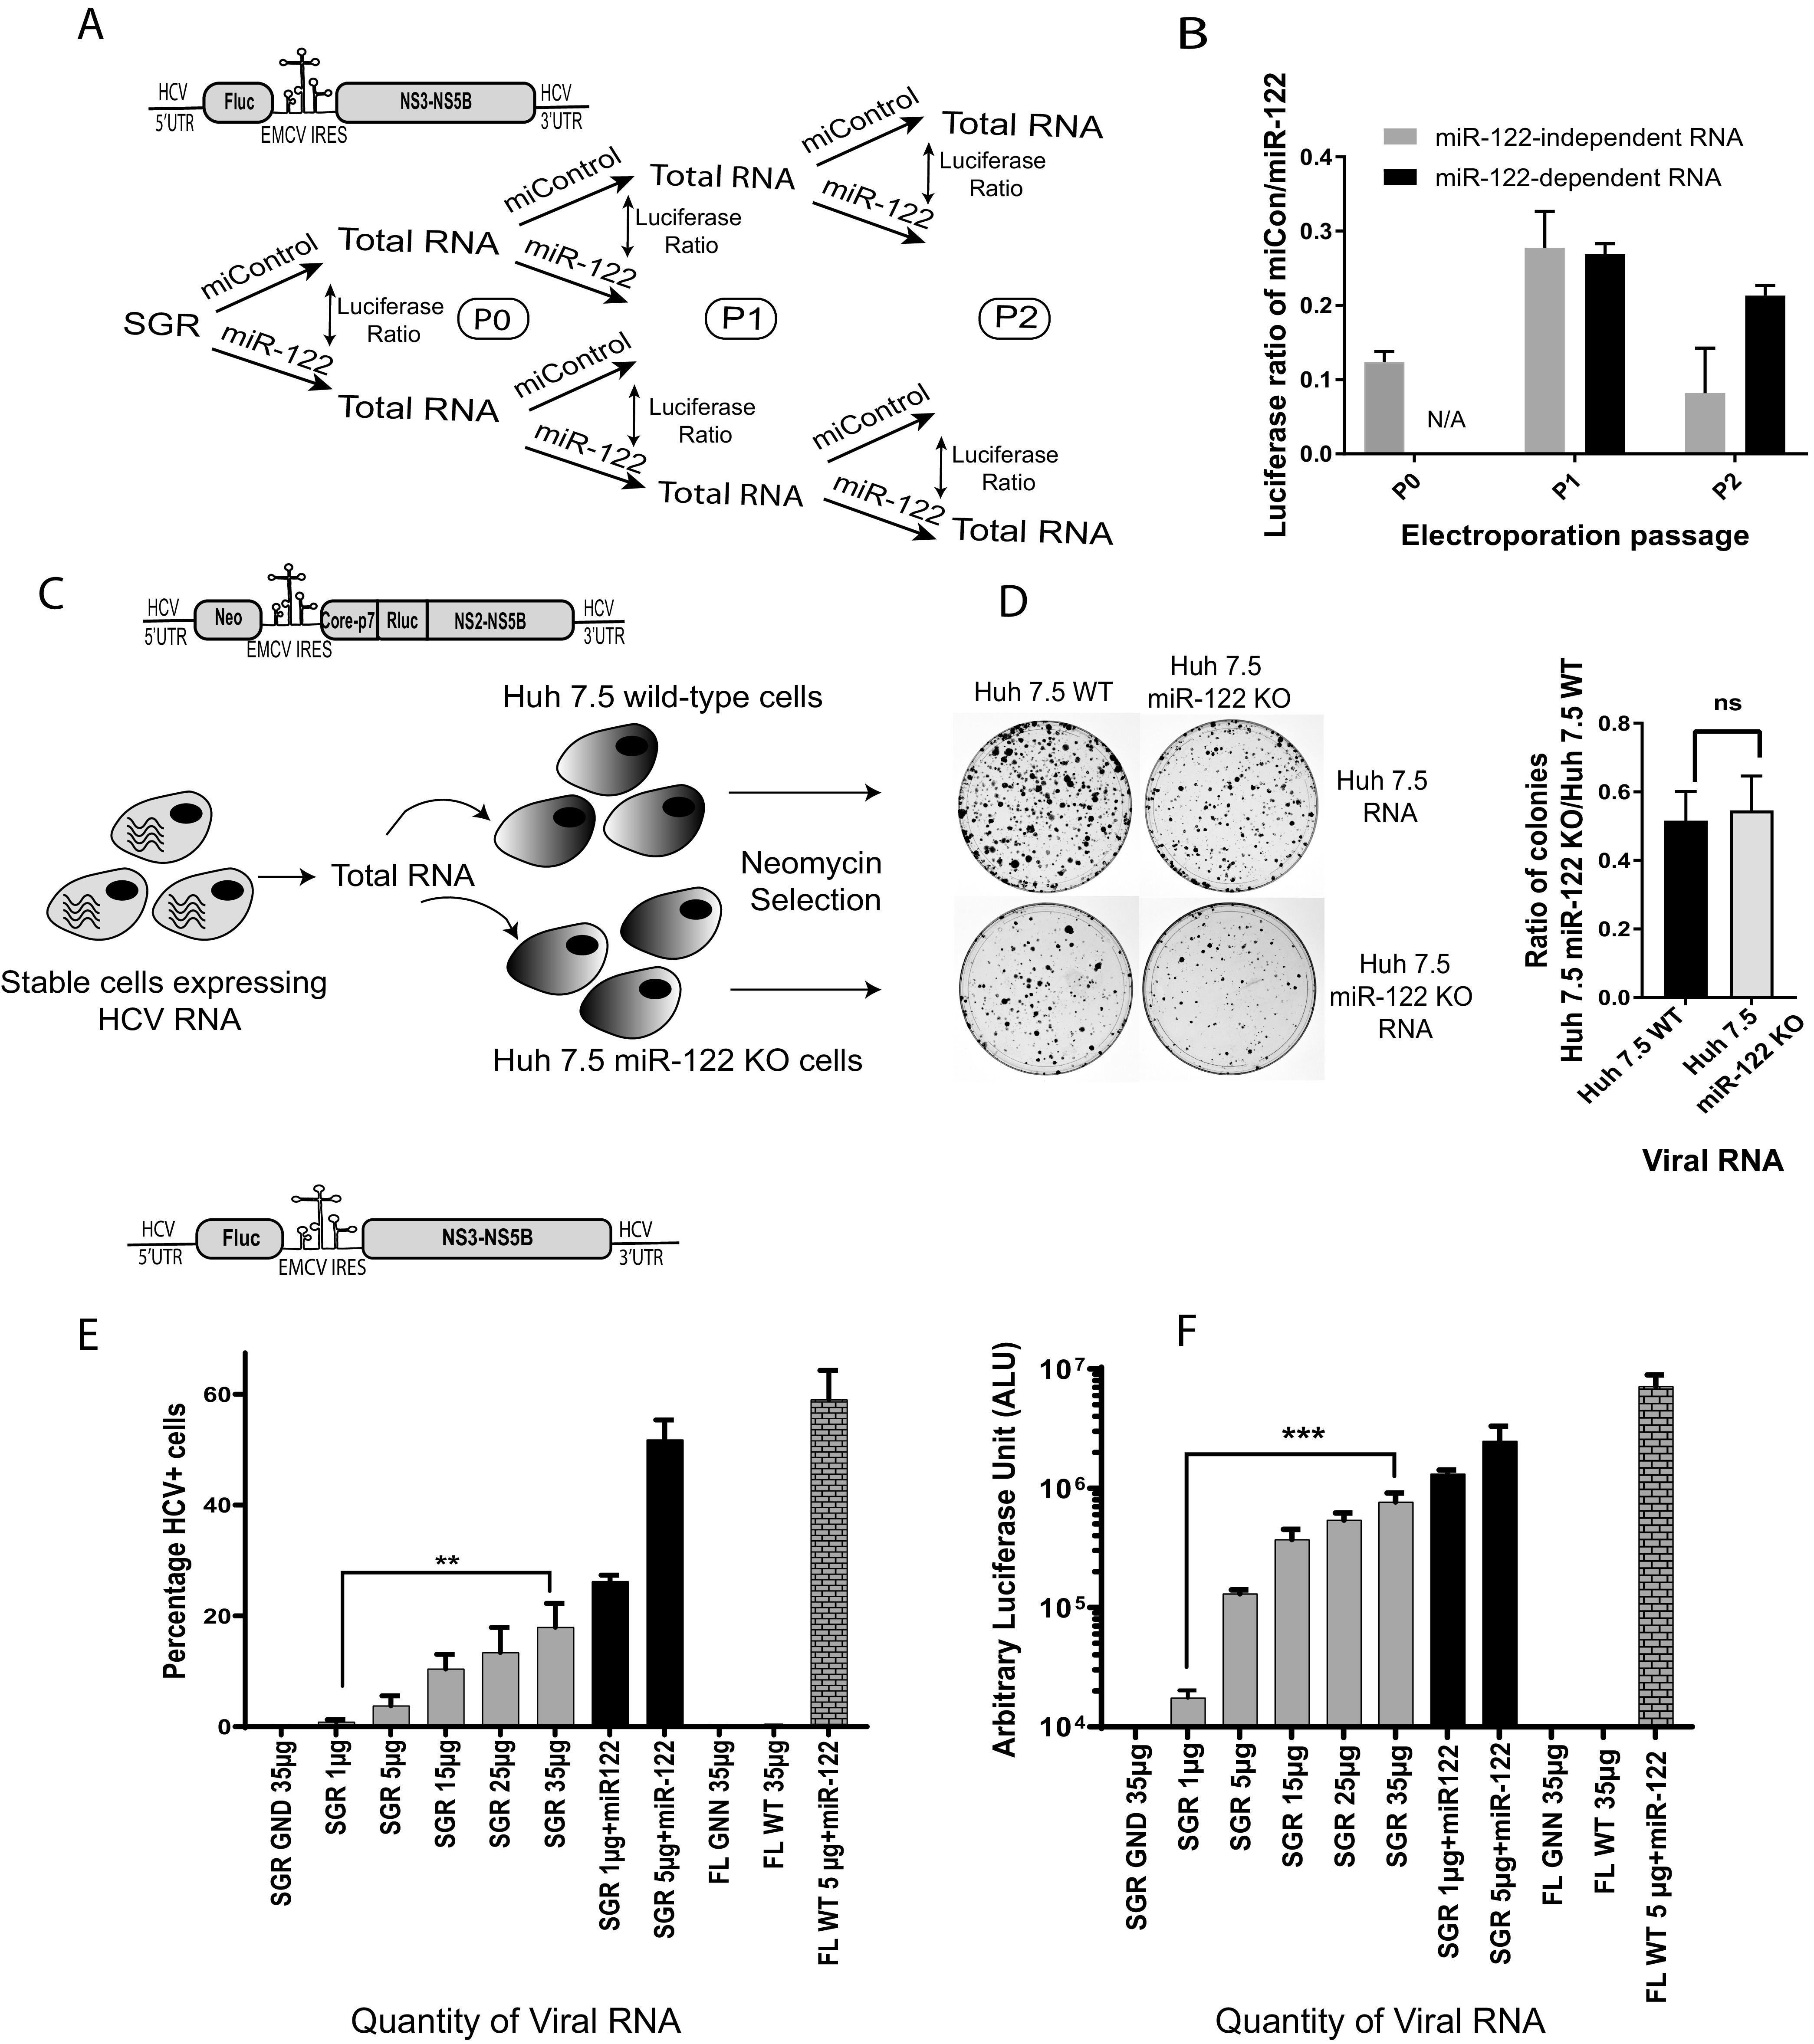
FIG 6.

There was no evidence of genome adaptation to the absence of miR-122 in HCV genomes passaged under miR-122-independent conditions. (A) Schematic diagram of the experiment to assess HCV adaptation to growth without miR-122. Total RNA was isolated from cells supporting transient miR-122-independent (miControl) or miR-122-dependent (miR-122) replication of HCV SGR JFH-1 Fluc and then reelectroporated into miR-122 KO Huh 7.5 cells with either miControl or miR-122. This was done for 3 RNA passages as shown. (B) The relative luciferase expression when RNA was electroporated with miControl was calculated versus the same RNA electroporated with miR-122 to determine the relative miR-122-independent replication ability of each RNA and plotted. (C) A schematic diagram of the experiment to test for HCV adaptation to replication without miR-122 in cells supporting stable miR-122-independent HCV replication. Huh 7.5 cells stably supporting miR-122-independent and miR-122-dependent replication of HCV J6/JFH-1 Neo (p7Rluc2a) were generated by electroporation of Huh 7.5 miR-122 KO or WT cells and selection with G418. (D) Total RNA from Huh 7.5 cells stably supporting miR-122-independent or miR-122-dependent replication was isolated and electroporated into new WT or miR-122 KO Huh 7.5 cells, and the ability to initiate miR-122-independent HCV replication was assessed based on colony formation and the ratio of colonies formed in Huh 7.5 miR-122 KO/WT cells. The constructs used for each experiment are shown above each diagram. (E and F) Transient replication assays showing the impact of the quantity of SGR JFH-1 Fluc RNA on the number of HCV + cells (E) and Fluc expression (F). In panel E the percentage of HCV positive cells was determined by using a fluorescence-activated cell sorter (FACS) and in panel F luciferase activity was assessed. SGR JFH-1 GND and J6/JFH-1 (p7Rluc2a) GNN (replication-defective mutants) were used as the negative controls. All data shown are the average of three or more independent experiments. Error bars indicate the standard deviation of the mean, and asterisks indicate significant differences. The significance was determined by using Student’s t test (ns, not significant; **, P < 0.002; ***, P < 0.001).
