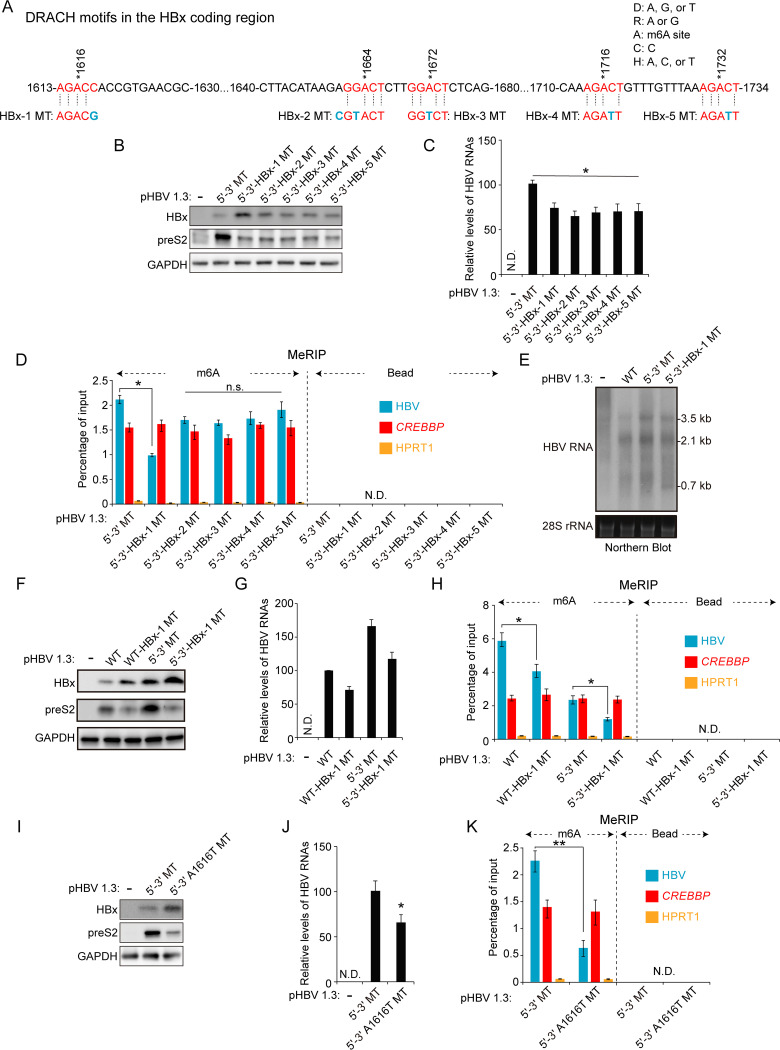
FIG 3.
Of the additional variant m6A sites in the HBx coding region, m6A modification at nt 1616 of the HBV genome regulates HBx protein expression. (A) The location of m6A consensus DRACH motifs within the minor m6A peak (1613 to 1734 nt) of the HBV genome is shown in red. Blue characters indicate mutations to disrupt the DRACH motifs in the HBx coding region. HBx-1, -2, -3, -4, or -5 MT contains the mutation of the DRACH motif at the position indicated in blue. (B to D) The indicated HBV expression plasmids were transfected into Huh7 cells for 72 h. Cell lysates and total RNA were extracted from these cells. (B) The indicated proteins were analyzed by immunoblotting. (C) HBV RNAs were analyzed by RT-qPCR. (D) m6A-methylated RNAs were immunoprecipitated from total RNA using an anti-m6A antibody, and m6A-methylated HBV RNA levels were normalized to input RNA levels by RT-qPCR. (E) Huh7 cells were transfected with pHBV 1.3 WT, 5′–3′ MT, or 5′–3′-HBx-1 MT plasmid for 72 h. Cellular HBV RNAs were analyzed by Northern blotting. (F to H) Huh7 cells were transfected with the indicated plasmids for 72 h. Cell lysates and total RNA were extracted from these cells. (F) The indicated protein expression levels were analyzed by Western blotting. (G) HBV RNA levels were analyzed by RT-qPCR. (H) m6A-methylated RNAs were immunoprecipitated from total RNA using an anti-m6A antibody and m6A-methylated HBV RNAs were normalized by input RNA levels by RT-qPCR. (I to K) Huh7 cells were transfected with pHBV 1.3 5′–3′ MT or pHBV 1.3 5′–3′-A1616T MT plasmid for 72 h. (I) The indicated proteins were analyzed by Western blotting. (J) HBV RNA levels were analyzed by RT-qPCR. (K) m6A methylated HBV RNAs were immunoprecipitated from total RNA using an anti-m6A antibody and normalized by input RNA levels by RT-qPCR. In panels C, D, G, H, J, and K, the error bars represent the SDs from three independent experiments. The P values were calculated via an unpaired Student's t test. *, P < 0.05; **, P < 0.01. n.s., nonsignificant; ND, not detected.

