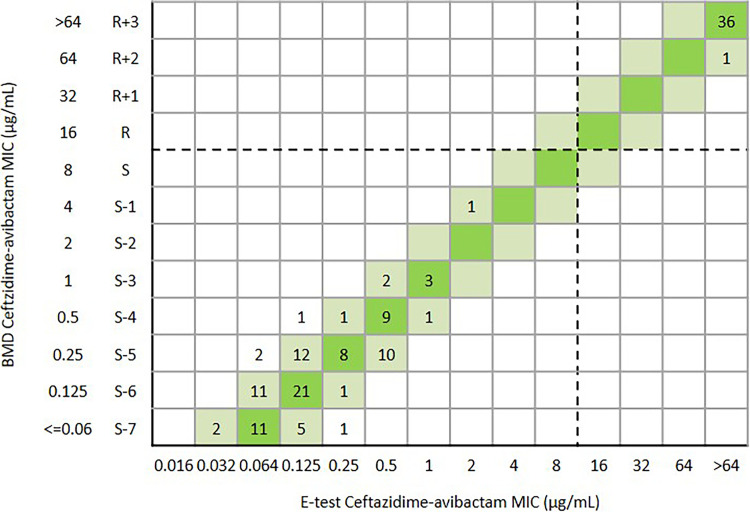
FIG 6.
Scattergram comparing the results of ceftazidime-avibactam BMD MIC values (μg/mL) and Etest MIC values (μg/mL) against E.coli (n = 139). Dotted lines indicate ceftazidime-avibactam breakpoints (CLSI). The green and reseda background indicates that the EA of ceftazidime-avibactam BMD and Etest.

