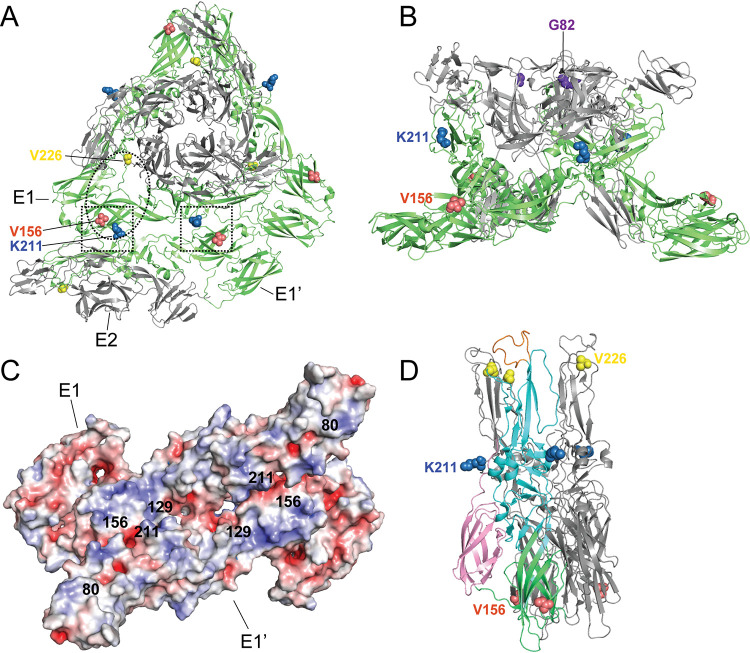
FIG 9.
Structural visualization of E1 residues 156 and 211. (A) Top view of CHIKV E1/E2 spike and E1-E1 interspike interface (PDB entry 2XFB). Squares denote positions 156 and 211 that face each other on E1 and E1′. Oval denotes approximate region predicted to interact with Mxra8 (18). (B) Side view of E1/E2 spike (PDB entry 2FXB). (C) Electrostatic potentials of E1-E1 interspike interface. E1 residues of interest are indicated. Negative electrostatic potential is shown in red, and positive electrostatic potential is in blue. (D) Semliki Forest virus E1-E1 postfusion spike (PDB entry 1RER) with one E1 monomer colored by domain (green, domain I; cyan, domain II; pink, domain III). The E1 fusion loop is shown in orange.

