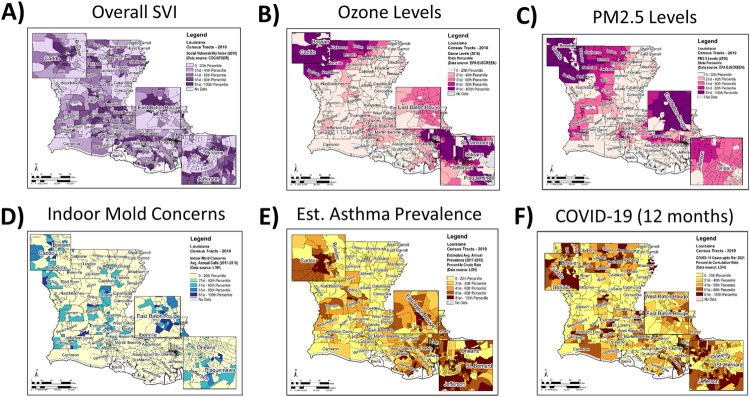
Fig 2. Spatial analysis of social and environmental vulnerability, asthma and COVID-19.
Darker colors for each measure indicate higher percentile ranks. Most counties in LA had census tracts with SVI (A) above the median. Ozone (B) and PM2.5 (C) were higher in the northwest and southeastern parts of the state. Indoor environmental quality concerns (mostly in the form of mold complaints) were also reported from all over the state (D). Estimated prevalence of asthma (E) was often above the median in census tracts located in the northwestern, western, southern and southeastern parishes. At the 12-month time point, cumulative COVID-19 incidence rates (F) were higher in the northern, northwestern and southeastern parts of the state.

