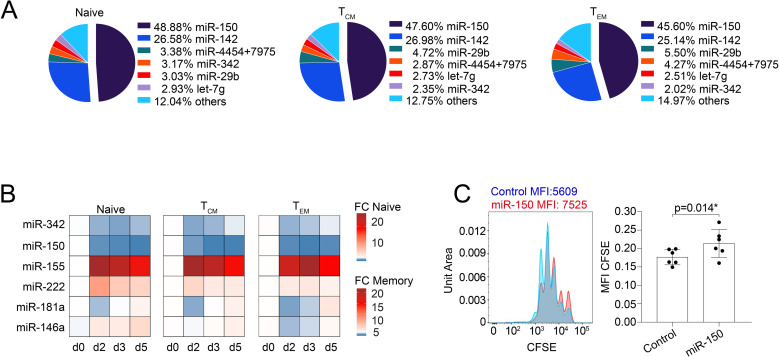
Fig 1. MiRNA expression in human CD4+ T-cell subsets.
(A) Total RNA was extracted from freshly isolated CD4+ naive, TCM, and TEM T-cell subsets, and miRNA expression was measured by NanoString SPRINT profiling. The most highly expressed miRNAs are shown, and data are expressed as percentage of normalized counts over the total. N = 3 independent donors. (B) Total RNA was extracted from the indicated T-cell subsets freshly isolated from peripheral blood. MiRNA expression was measured by RT-qPCR, and data are expressed as 2−ΔCt. N = 3 independent donors. (C) Freshly isolated memory T lymphocytes were loaded with CFSE, transfected with either a miR-150 mimic or a control oligonucleotide, and activated with anti-CD3 and anti-CD28 antibodies. The extent of cell proliferation was measured 3 days after activation. Data in the bar graph were normalized to the overall baseline signal on day 0, prior to stimulation, to compensate from experimental differences in basal CFSE loading. N = 6 independent experiments. Mean ± SD. Student t test, 2 tailed, paired. Underlying data can be found in S1 Data. CFSE, carboxyfluorescein succinimidyl ester; miRNA, microRNA; RT-qPCR, reverse transcription quantitative PCR.

