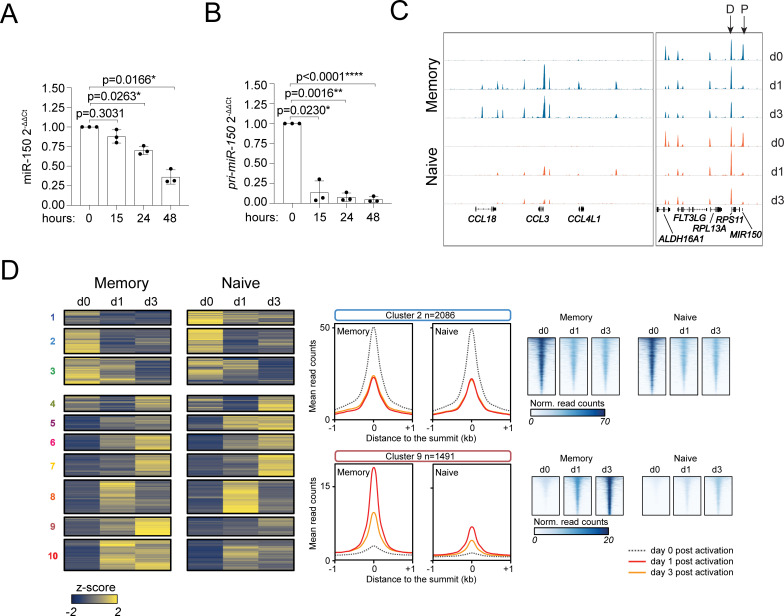
Fig 6. ATAC-seq analysis in human CD4+ T-cell subsets.
(A) Memory T cells were sorted from peripheral blood and were either left resting or activated with plate-bound anti-CD3 and anti-CD28 antibodies for the indicated number of hours. Total RNA was extracted and miR-150 expression was measured by RT-qPCR. N = 3 independent donors (each dot represents one donor). Mean ± SD. One-way ANOVA. Underlying data can be found in S1 Data. (B) Same as (A), except that the expression of pri-miR-150 was measured. N = 3. Mean ± SD. One-way ANOVA. Underlying data can be found in S1 Data. (C) Naive and memory T cells were freshly isolated from 3 independent donors and were either left resting or were stimulated with anti-CD3 and anti-CD28 antibodies for 1 or 3 days, before tagmentation and sequencing for ATAC-seq analysis. Representative snapshots of the sequencing tracks. Arrows indicate the distal (D) and proximal (P) peaks relative to MIR150. (D) Clustering analysis including all ATAC-seq peaks that were significantly affected after 24 hours or 72 hours of activation in either naive or memory T cells, with different representations of cluster 2 and 9 (middle and right panels). ATAC-seq, assay for transposase accessible chromatin and sequencing; RT-qPCR, reverse transcription quantitative PCR.

