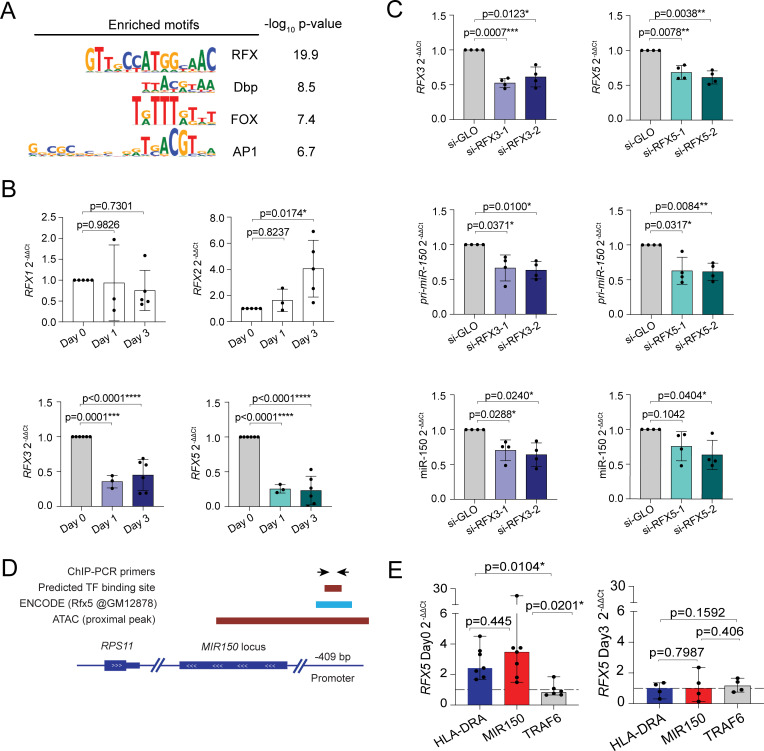
Fig 7. RFX factors regulate miR-150 expression.
(A) Transcription factor motifs enrichment analysis. Peaks in cluster 2 were compared to all accessible sites detected. (B) Memory T lymphocytes were stimulated with plate-bound anti-CD3 and anti-CD28 antibodies for the indicated times. Total RNA was extracted and the expression of the different RFX mRNAs was measured by RT-qPCR. N = 3 to 6 independent donors (each dot represents one donor). Mean ± SD. One-way ANOVA. (C) Resting memory T lymphocytes were transfected with siRNAs targeting either RFX3 (left) or RFX5 (right). Twenty-four hours after transfection, total RNA was extracted and the expression of the indicated genes measure by RT-qPCR. N = 4 independent donors (each dot represents one donor). Mean ± SD. Paired t test, 2 tailed. (D) Schematic representation of the MIR150 locus, with overlapping ATAC peak and the location of an RFX5 ChIP-seq peak in the human B lymphocyte cell line GM12878 as described by the ENCODE project (ChIP-Atlas). The location of PCR primers for ChIP analysis of RFX5 binding is also indicated. (E) RFX5 binding at the indicated genomic loci was determined by ChIP-qPCR in resting (day 0) and activated (day 3) memory T lymphocytes. Data were normalized on the input and a control immunoprecipitation with an irrelevant antibody for each target (dashed line y = 1). Target genes exceeding the dashed line threshold were considered to be bound by RFX5. Data are shown as median with 95% confidence interval; at least N = 4 independent human donors. Each dot represents one experiment. Ratio paired t test, 2 tailed. Underlying data can be found in S1 Data. ChIP, chromatin immunoprecipitation; RT-qPCR, reverse transcription quantitative PCR; RFX, regulatory factor X; siRNA, small interfering RNA.

