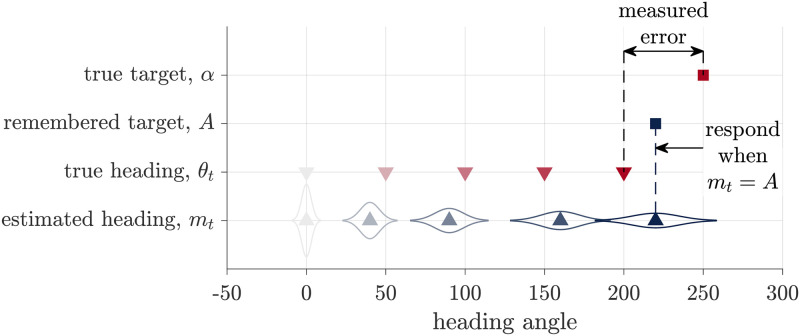
Fig 2. Schematic of the Path Integration model.
During path integration, participants keep track of a probability distribution over their heading, which is centered at mean mt. To respond they compare this estimated heading to their remembered target location, A, halting their turn when mt = A. The experimenter observers neither of these variables, instead we quantify the measured error as the difference between the true target angle, α, and the true heading angle, θt.

