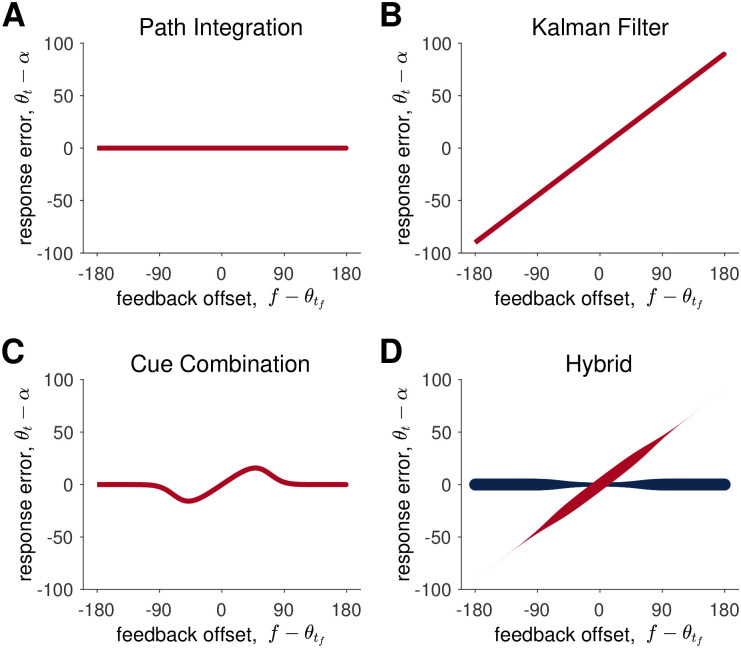
Fig 3. Model predictions for the Path Integration, Kalman Filter, Cue Combination, and Hybrid models.
In (A-C) the red lines correspond to the mean of the response error predicted by the model. In (D) the two lines correspond to the mean response when the model assumes the feedback is true (red) and false (blue). The thickness of the red and blue lines in (D) corresponds to the probability that the model samples from a distribution with this mean, i.e. ptrue for red and 1 − ptrue = pfalse for blue.

