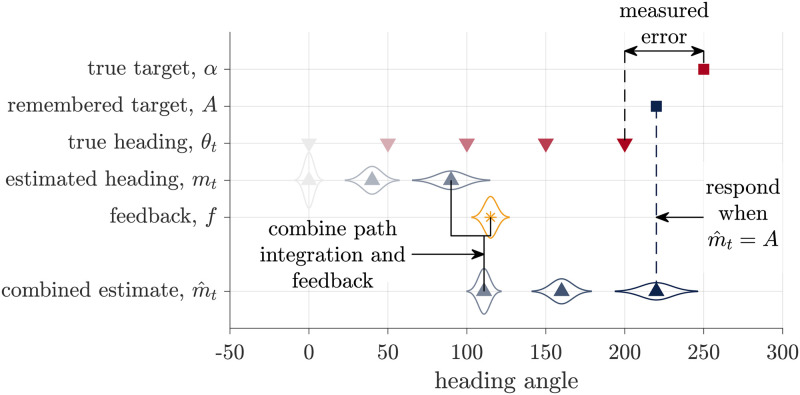
Fig 4. Schematic of the Kalman Filter model.
Similar to the Path Integration model, this models assumes that participants keep track of a probability distribution over their heading that, before the feedback, is centered on mean mt. When the feedback, f, is presented, they combine this visual information with their path integration estimate to compute a combined estimate of heading . They then stop turning and register their response when , their remembered target. As with the Path Integration model, none of these internal variables are observed by the experimenter, who instead measures the error as the difference between the true target, α, and heading angle θt.

