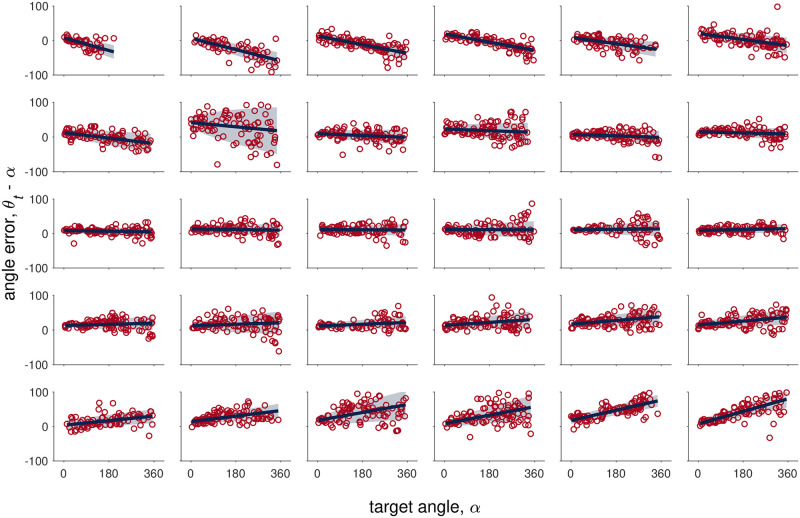
Fig 7. Error vs target angle for the No Feedback condition.
Each plot corresponds to data from one participant and plots are ordered from most negative slope (top left) to most positive slope (bottom right). The red circles correspond to human data, the solid blue to the mean error from the Path Integration model fit, and shaded blue area to the mean ± standard deviation of the error from the Path Integration model fit.

