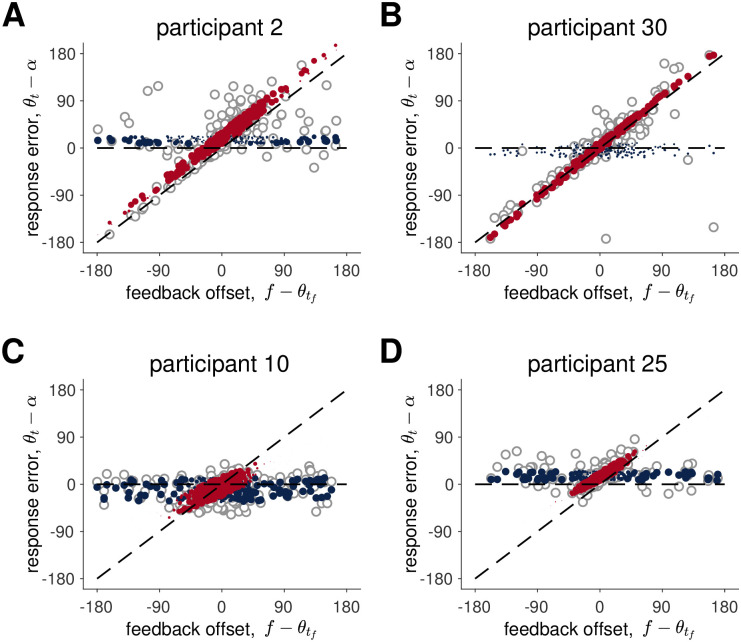
Fig 11. Comparison between data and the Hybrid model for four participants.
Four participants’ data (open grey dots) are overlaid hybrid model’s mean responses when the model assumes the feedback is true (red) and false (blue). The size of the dots corresponds to the probability that the model samples from a distribution with this mean, i.e. ptrue for red and 1 − ptrue = pfalse for blue.

