
Fig 4. Comparison of Ka (derived from IC50 data) and normalized log10 K* score.
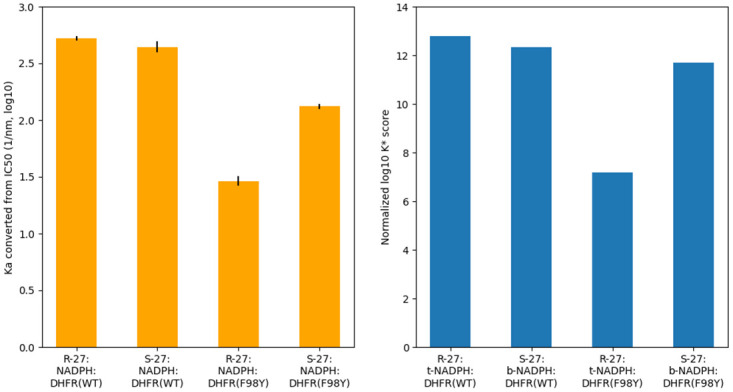
Bar graphs of Ka and K* score values (both in log10) for different systems. K* scores are normalized as described in S1 Text. Normalized log10 K* scores are in good concordance with Ka, which is derived from IC50 using Cheng-Prusoff equation. Black bars represent uncertainty from experimental measurments of IC50.