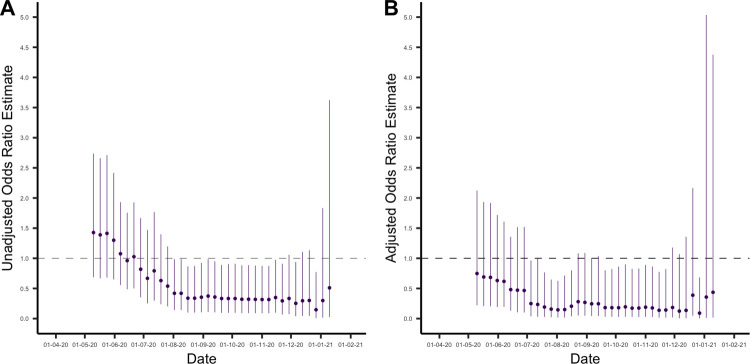
Fig 3.
(A) Unadjusted odds ratio estimates comparing odds of reinfection in the seropositive group with odds of primary infection in the seronegative group. The estimates are presented with their associated 95% CIs and with the cutoff week used to define baseline seroprevalence on the x-axis. (B) Odds ratio estimates comparing odds of reinfection in the seropositive group with odds of primary infection in the seronegative group, estimated using logistic regression and adjusted for potential confounders. The estimates are presented with their associated 95% CIs and with the cutoff week used to define baseline seroprevalence on the x-axis. Data underlying this figure can be found in https://github.com/EmilieFinch/covid-reinfection.

