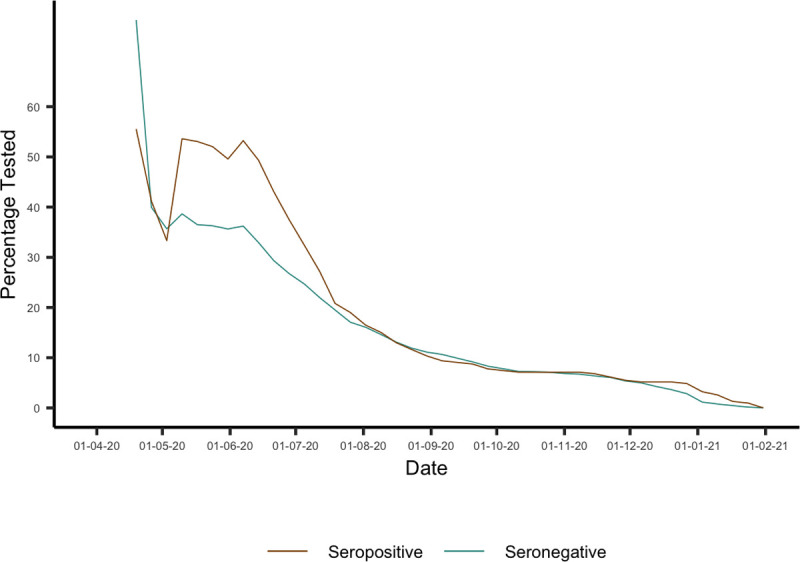
Fig 4. Propensity to seek a PCR test between the seronegative and seropositive groups, for each cutoff week considered in the main analysis.

This was calculated as the percentage of those enrolled by the cutoff week shown on the x-axis who received at least 1 PCR test in the subsequent observation period. Data underlying this figure can be found in https://github.com/EmilieFinch/covid-reinfection.
