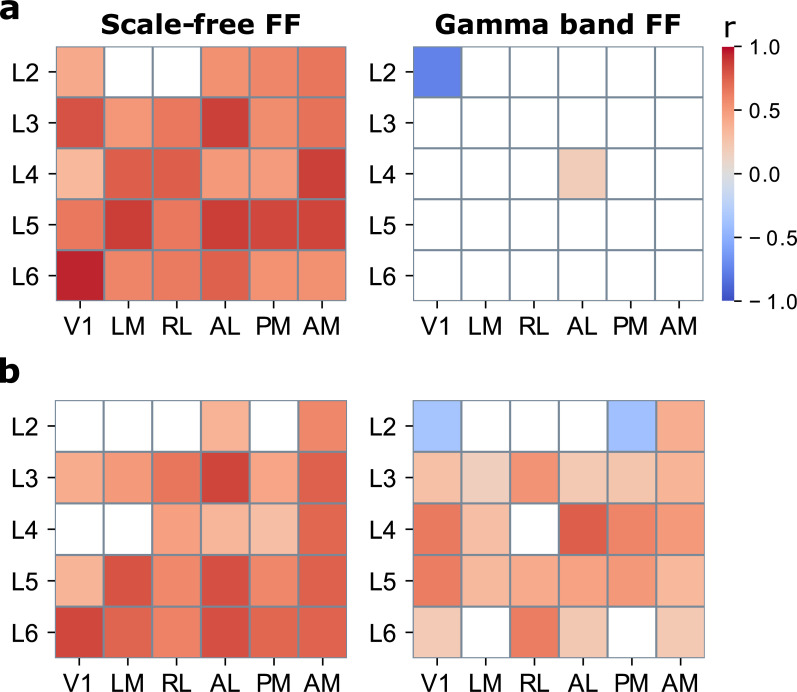
Fig 6. Correlations between network amplitudes and spiking activity.
(a) Correlation coefficients (r) per area and layer for high contrast stimuli and (b) for low contrast stimuli. Colored areas indicate statistically significant correlations at p < 0.05, 2-tailed bootstrapped distribution. L1 was excluded for lack of spiking activity. Underlying data: https://osf.io/pqf7z. FF, feedforward.

