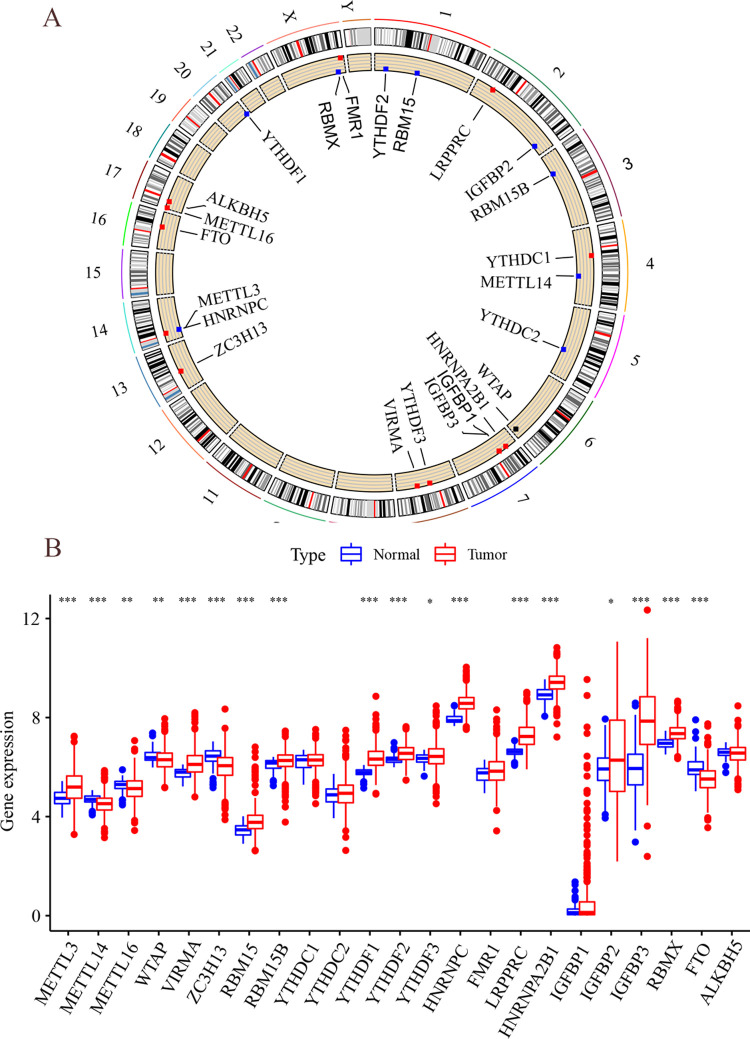
Fig 2. Copy number of m6A in chromosomes and analysis of differences.
(A) Copy number circle plot. Distribution of m6A regulators in 22 pairs of autosomes and 1 pair of sex chromosomes, red circles indicate copy number increase, and blue circles indicate copy number decrease. (B) TCGA-m6A differential analysis. Horizontal coordinates indicate m6A regulators, vertical coordinates indicate gene expression, * P < 0.05, * * P < 0.01, and * * * P < 0.001.

