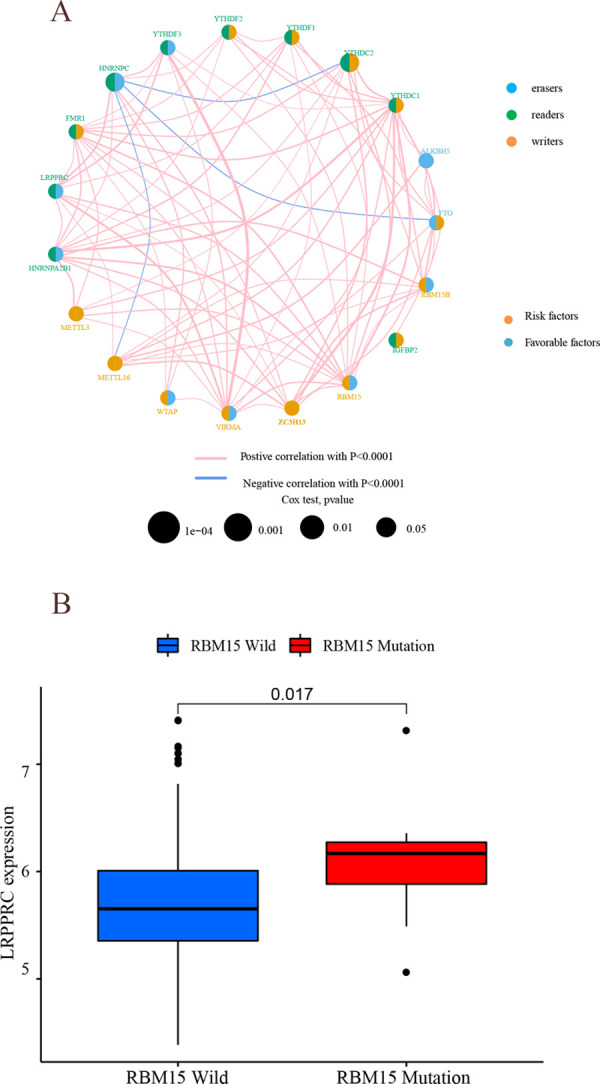
Fig 3. Analysis of m6A regulators.

(A) m6Aprognostic network diagram. In the circle corresponding to each m6A modified gene, the yellow part of the left half-circle indicates risk genes, the blue part indicates protection genes, the blue part of the right half-circle indicates demethylase, the green part indicates methylated reading protein, the yellow part indicates methyltransferase, the pink linkage between genes indicates synergism, and the blue linkage indicates repression. (B) Mutation and expression correlation analysis. The horizontal coordinates indicate the RBM15 wild group and mutant group, respectively, while the vertical coordinates indicate the LRPPPC expression.
