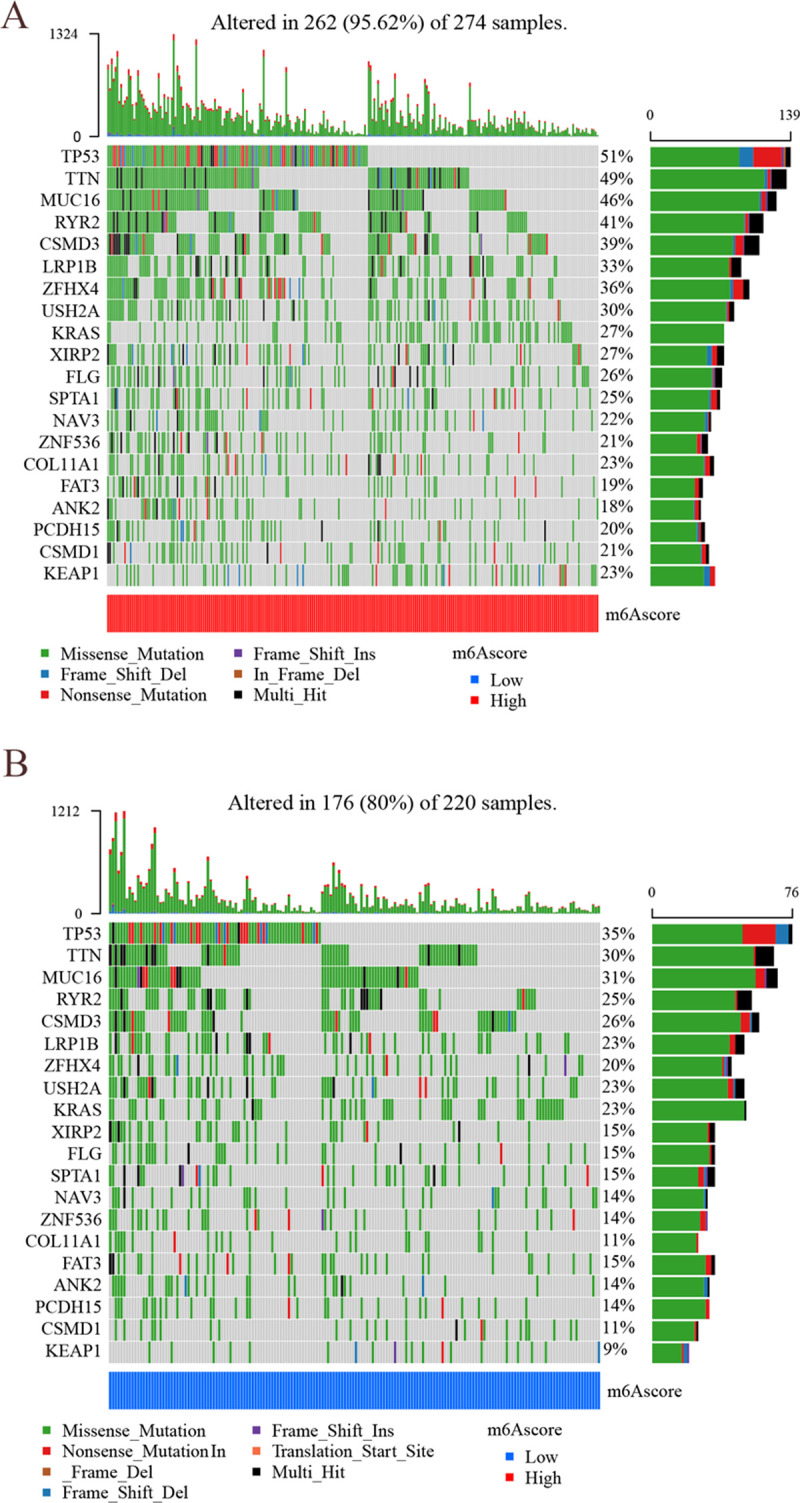
Fig 13. Mutation waterfall plot for high and low m6A score groups.

(A) The mutation rates of high m6A score groups. The left vertical coordinate indicates m6A-related modified genes, and the right vertical coordinate indicates gene mutation rate in LUAD. (B) The mutation rates of low m6A score groups. The left vertical coordinate indicates m6A-related modified genes, and the right vertical coordinate indicates gene mutation rate in LUAD.
