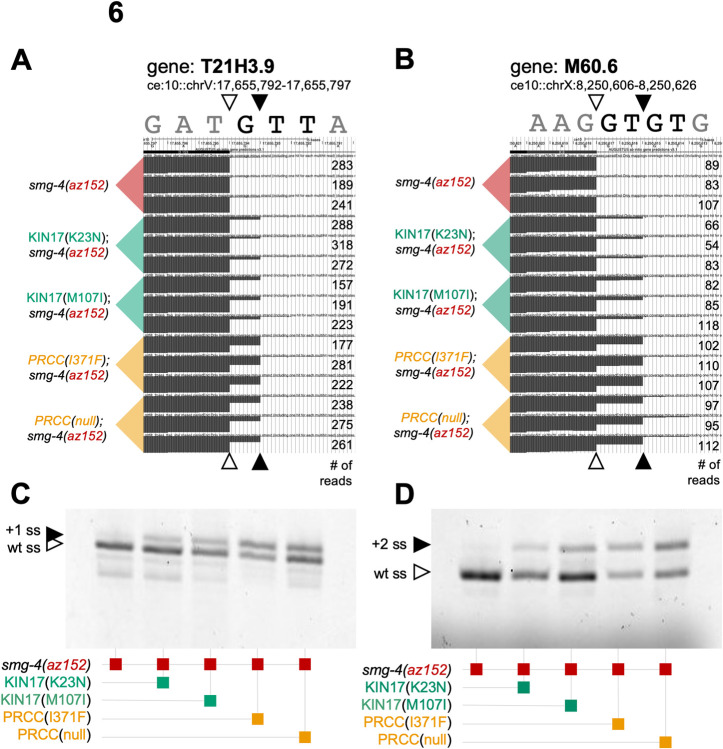
Fig 6. KIN17(K23N) and KIN17(M107I) affect 5’ splice site in a similar manner to PRCC mutations, but with a smaller effect size.
(A) UCSC Genome Browser shot of RNA-seq coverage tracks at the gene T21H3.9. For each of five strains indicated on the left-hand side, three replicates are visible for each, the number of reads supporting the track is on the right-hand side. White triangles indicate the wildtype splice site reduced in mutant; black triangles indicate the alternative splice site promoted in mutant. The 5’ splice site switching in KIN17 is above wildtype levels but did not meet our strict criteria for inclusion in Table 1. (B) UCSC Genome Browser shot of RNA-seq coverage tracks at the gene M60.6. For each of five strains indicated on the left-hand side, three replicates are visible for each, the number of reads supporting the track is on the right-hand side. White triangles indicate the wildtype splice site reduced in mutant; black triangles indicate the alternative splice site promoted in mutant. The 5’ splice site switching in KIN17 is above wildtype levels but did not meet our strict criteria for inclusion in Table 1. (C) Verification of RNA-seq results showing that KIN17 mutations switch 5’ ss, just not as strongly as PRCC mutations. Image is a scan of a denaturing poly-acrylamide gel showing Cy-3 labeled T21H3.9 PCR products from mixed-stage cDNA. (D) Verification of RNA-seq results showing that KIN17 mutations switch 5’ ss, just not as strongly as PRCC mutations. Image is a scan of a denaturing poly-acrylamide gel showing Cy-3 labeled M60.6 PCR products from mixed-stage cDNA. Quantification of three biological replicates of the gels in parts C and D are provided in S5 Table.

