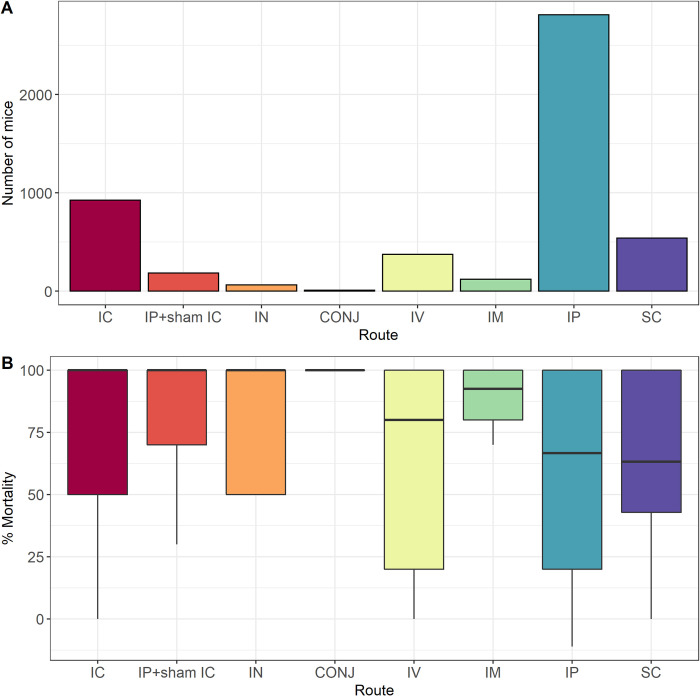
Fig 7. Summary of the number of mice and mortality in mice challenged by different routes of administration.
A: Bar chart of the number of mice included in the meta-analysis (n = 5026) that were inoculated with JEV by different routes. B: Box plot of the percentage mortality of mice included in the meta-analysis (n = 5026) that were inoculated with JEV by different routes.

