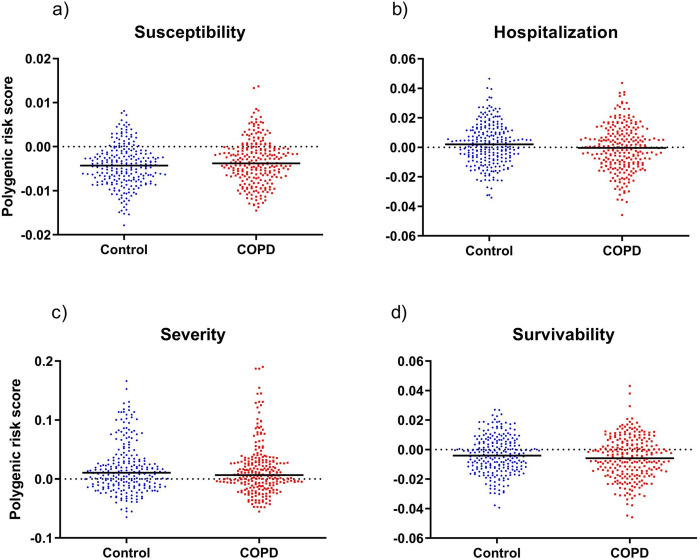
Fig 3.
Polygenic risk score for susceptibility to COVID-19 infection (a), hospitalization due to COVID-19 infection (b), severe COVID-19 with respiratory failure (c) and survivability to COVID-19 infection (d). Results shown as scatter dot plots with median represented. No significant differences were found between the polygenic risk scores of COPD and control groups for any of the phenotypes tested; a) p-value = 0.05; b) p-value = 0.03; c) p-value = 0.38; d) p-value = 0.09.

