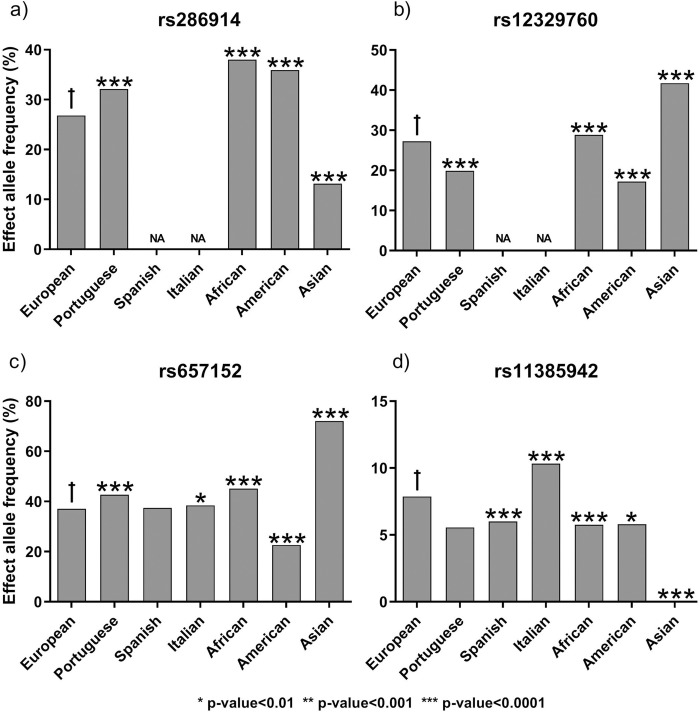
Fig 4.
Effect allele proportions for COVID-19 susceptibility (a and b) and severe response to COVID-19 infection (c and d) SNPs in different world populations. Bars represent the proportion of each allele in the respective population. Allele frequencies for rs286914, rs12329760 and rs11385942 were obtained from gnomAD-Genome project, while rs657152 allele frequencies were obtained from the ALFA project. *: p-value<0.01; **: p-value<0.001; ***: p-value<0.0001; ✝ - population used as reference for statistical analyses. NA—No data available.

