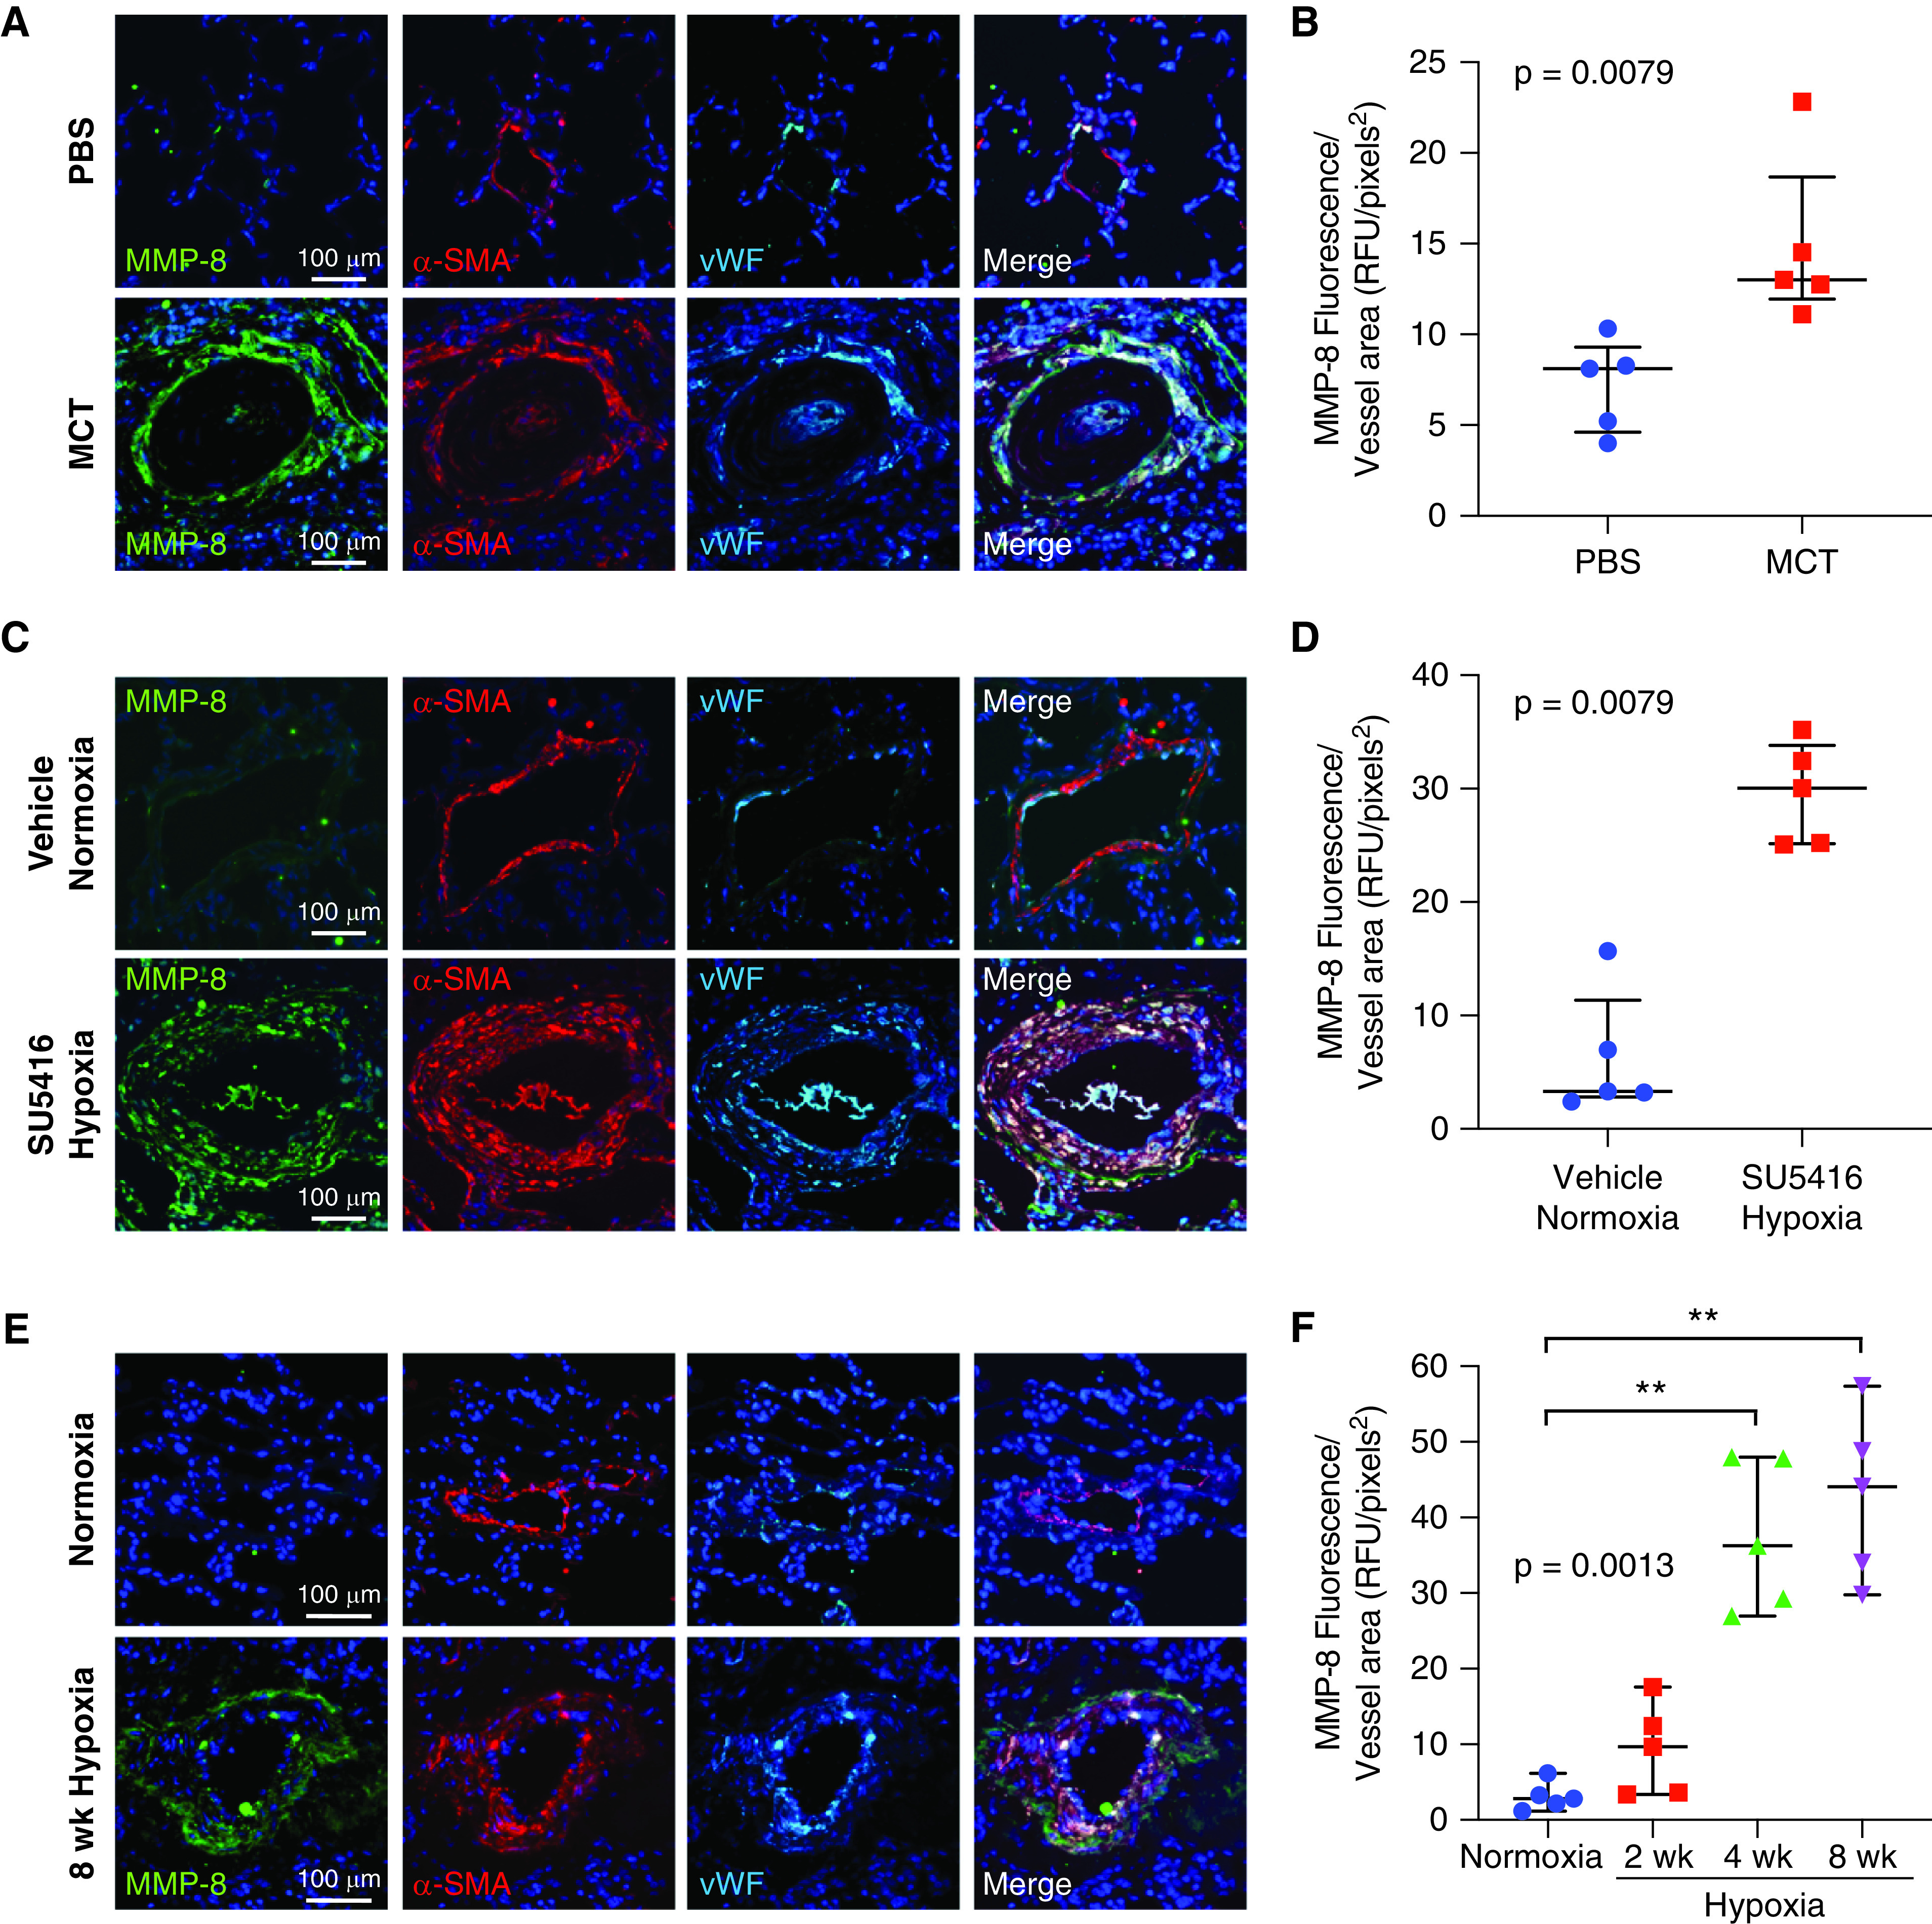
Figure 2.

MMP-8 (matrix metalloproteinase-8) expression is induced in the pulmonary vasculature in experimental models of pulmonary hypertension. (A and B) Sprague-Dawley rats were treated with monocrotaline (MCT) or phosphate-buffered saline (PBS; n = 5 per group), and lungs were harvested after 4 weeks. (C and D) Sprague-Dawley rats were treated with SU5416 or vehicle (n = 5 per group), exposed to hypoxia or normoxia for 3 weeks, and then returned to normoxia for an additional 5 weeks. Lungs were triple immunostained for MMP-8, α-SMA (α-smooth muscle actin), and vWF (von Willebrand factor). (A and C) Representative confocal images are shown for MMP-8 (green), α-SMA (red), and vWF (cyan) immunostaining. Merged images are shown to the right of each row. Scale bars, 100 μm. (B and D) MMP-8 fluorescence intensity was measured in 10 pulmonary arteries (PAs) (50–150 μm) per rat and normalized per vessel area using Metamorph software. The mean MMP-8 fluorescence intensity per vessel area for each rat is shown with median and interquartile range (IQR) per group. Statistical significance was determined by the Mann-Whitney U test. (E and F) C57BL/6 wild-type mice were exposed to normoxia or hypoxia for 2, 4, or 8 weeks (n = 5 per group). Lungs were triple immunostained for MMP-8, α-SMA, and vWF. Representative confocal images are shown for MMP-8 (green), α-SMA (red), and vWF (cyan) immunostaining for normoxia and 8 weeks of hypoxia. Merged images are shown to the right of each row. Scale bars, 100 μm. (F) MMP-8 fluorescence intensity was measured in 10 PAs (50–150 μm) per mouse and normalized per vessel area using Metamorph software. The mean MMP-8 fluorescence intensity per vessel area for each mouse is shown with median and IQR per group. Statistical significance was determined by Kruskal-Wallis one-way ANOVA (P = 0.0013) followed by Dunn’s multiple comparisons test (**P ⩽ 0.01). RFU = relative fluorescence units.
