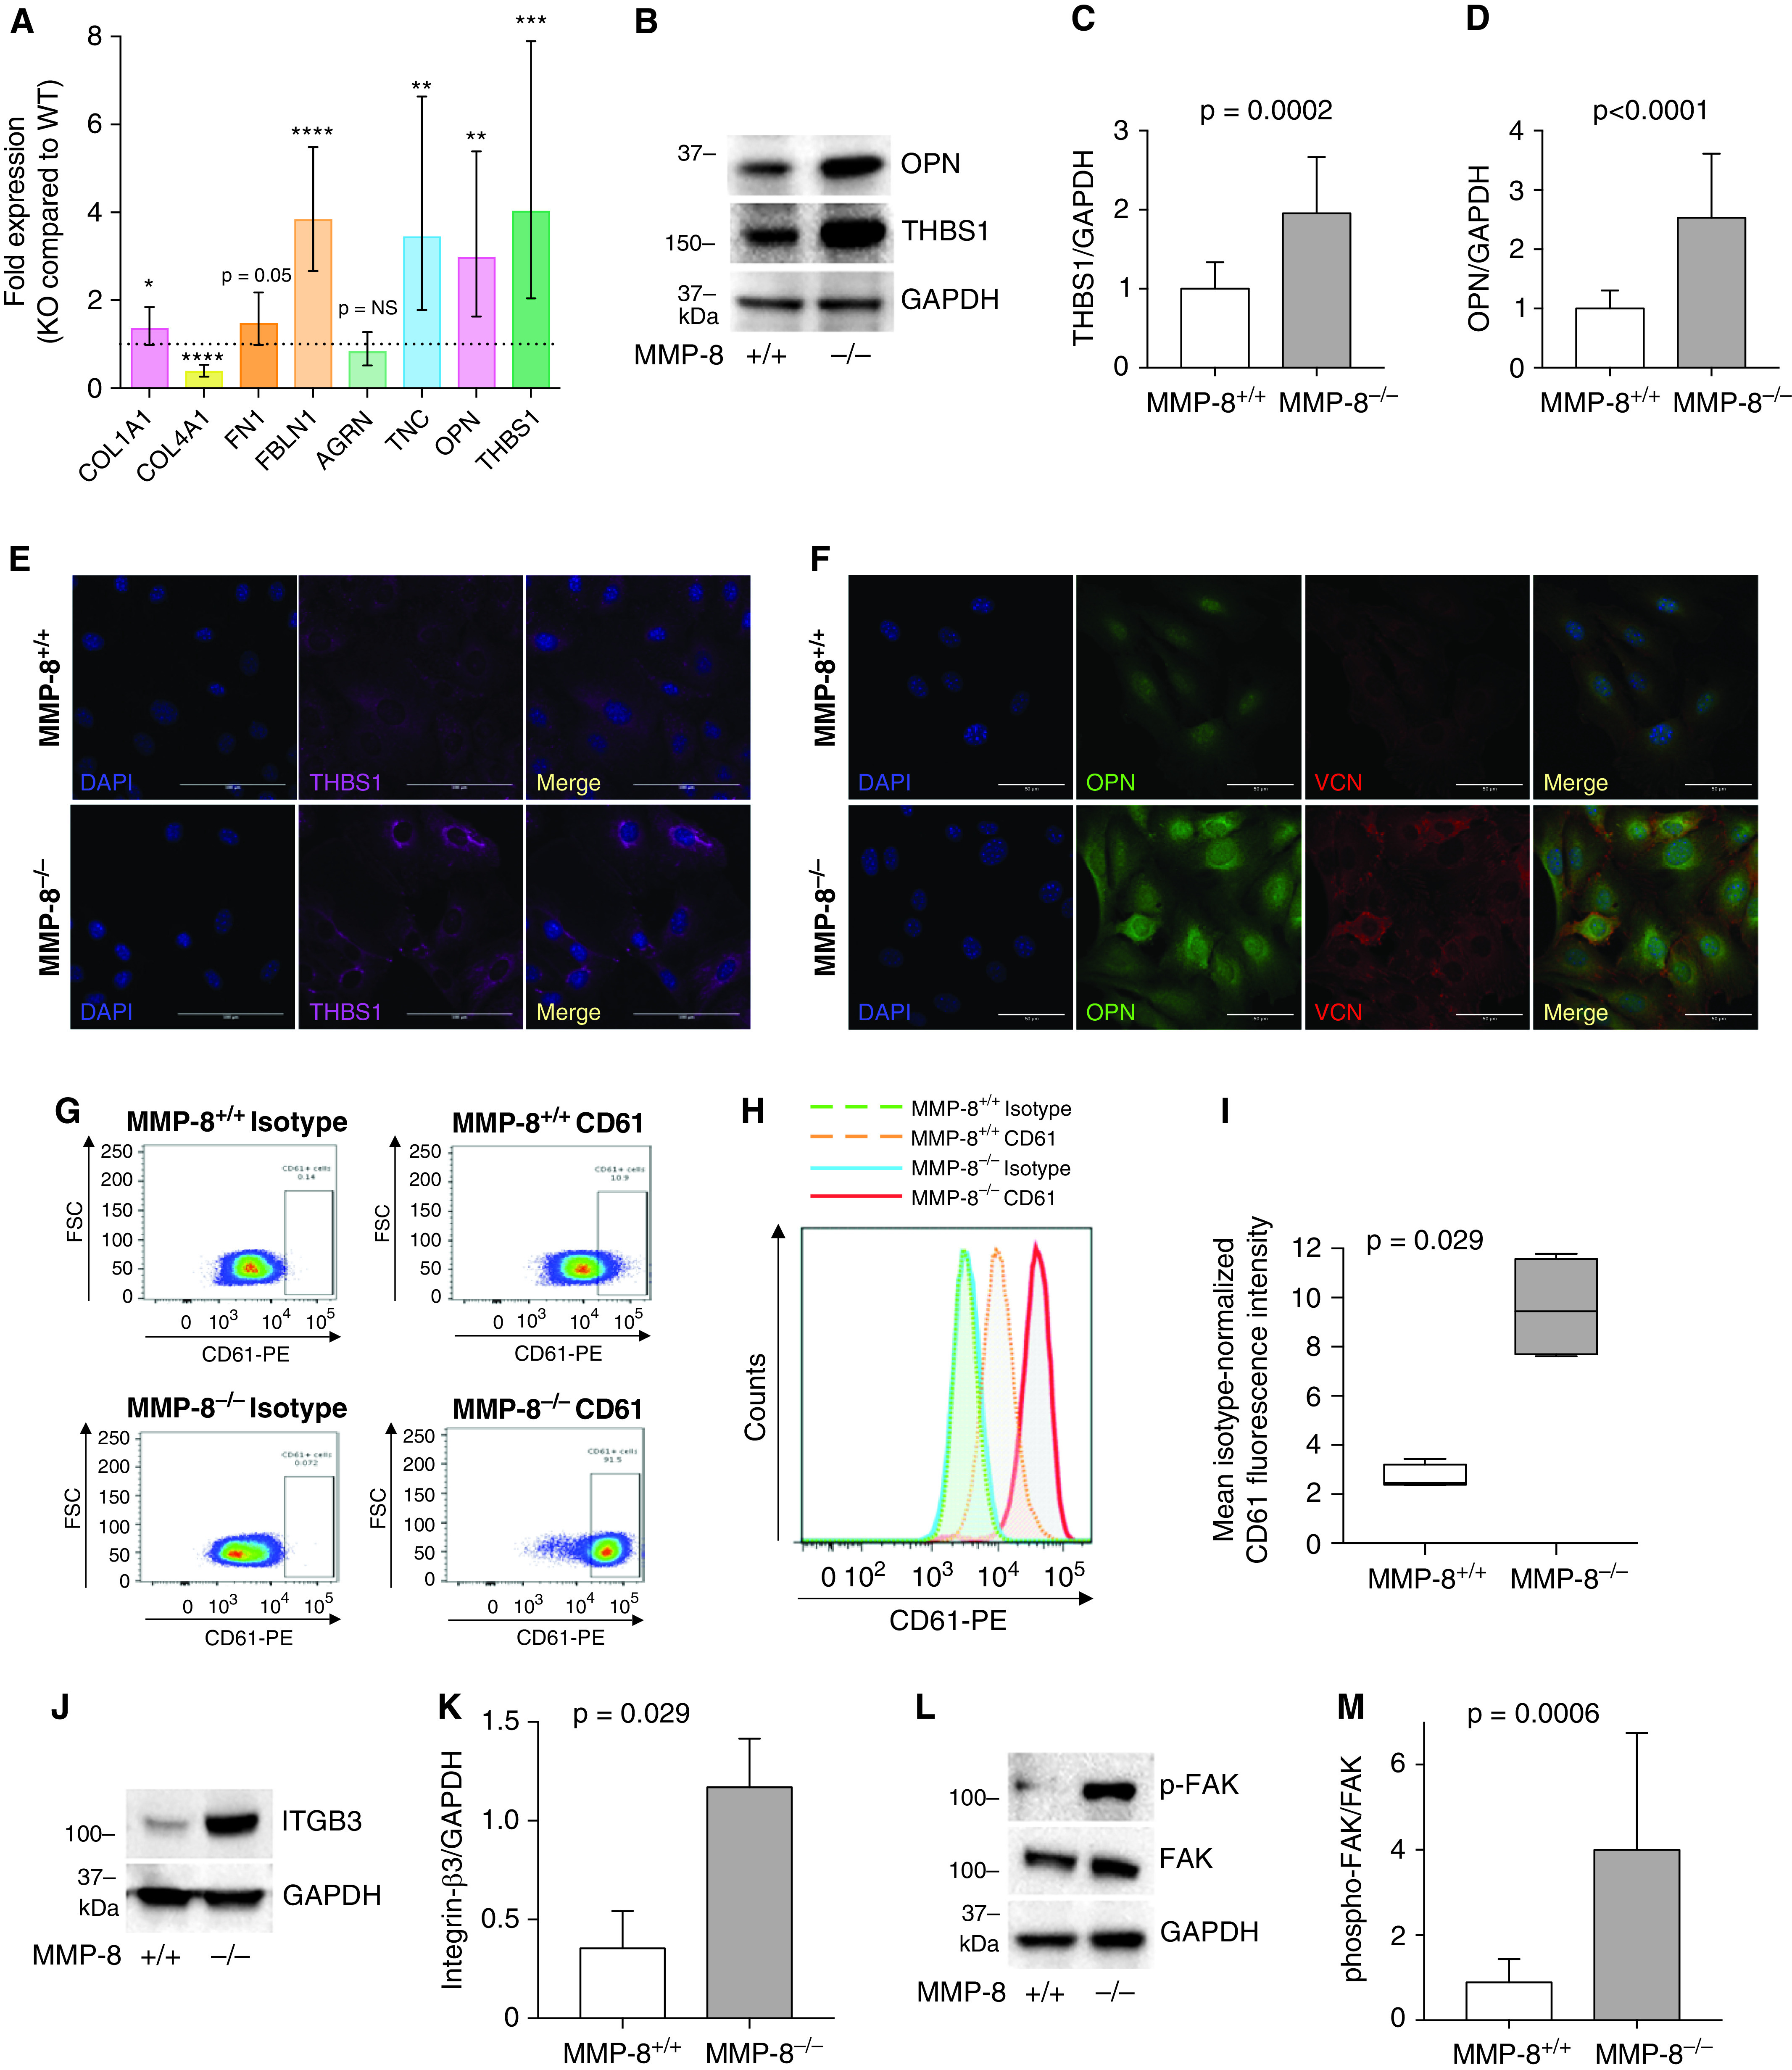
Figure 7.

MMP-8 (matrix metalloproteinase-8)–deficient pulmonary artery smooth muscle cells (PASMCs) demonstrate altered matrix protein expression leading to enhanced integrin signaling via FAK (focal adhesion kinase). (A) RNA was isolated from MMP-8+/+ and MMP-8–/– PASMCs and quantitative PCR was performed for COL1A1, COL4A1, FN1, FBLN1, AGRN, TNC, OPN, and THBS1. Data represent mean expression ± SD in MMP-8–/– (knockout [KO]) PASMCs normalized to MMP-8+/+ (wild-type [WT]) PASMC expression (n = 8 independent experiments). Statistical significance was determined by the Wilcoxon signed-rank test using ΔΔCT values (*P ⩽ 0.05, **P ⩽ 0.01, ***P ⩽ 0.001, and ****P ⩽ 0.0001). (B–D) Protein was isolated from MMP-8+/+ and MMP-8–/– PASMCs, and Western blot was performed using anti-OPN (osteopontin), anti-THBS1 (thrombospondin-1) and anti-GAPDH antibodies. Representative blots are shown. Quantification of (C) THBS1 and (D) OPN normalized to GAPDH protein expression (n = 8 independent experiments). Statistical significance was determined by the Mann-Whitney U test. (E and F) Immunofluorescence staining was performed for (E) THBS1 and (F) OPN and VCN (vinculin) in MMP-8+/+ and MMP-8–/– PASMCs, and counterstaining was performed with DAPI. Representative THBS1 (magenta), OPN (green), VCN (red), and DAPI (blue) images of MMP-8+/+ and MMP-8–/– PASMCs. Merged images are shown to the right of each row. Scale bars, 100 μm. (G–I) MMP-8+/+ and MMP-8–/– PASMCs were stained with anti-CD61-PE (integrin-β3), fixed, and analyzed via flow cytometry. (G and H) Representative dot and histogram plots for CD61 in MMP-8+/+ and MMP-8–/– PASMCs compared with isotype controls. (I) Mean isotype-normalized CD61 fluorescence intensity in MMP-8+/+ and MMP-8–/– PASMCs (n = 4 independent experiments). Data represent 25th–75th percentiles (box), median (line), and minimum and maximum values (whiskers). Statistical significance was determined by the Mann-Whitney U test (P = 0.029). (J–M) Protein was isolated from MMP-8+/+ and MMP-8–/– PASMCs, and Western blot was performed using anti–ITGB3 (integrin-β3), anti-phospho-FAK (Tyr397) (p-FAK), FAK, and anti-GAPDH antibodies. Representative blots are shown. Quantification of (K) integrin-β3 (n = 4) normalized to GAPDH protein expression and (M) p-FAK normalized to FAK (n = 7) protein expression. Statistical significance was determined by the Mann-Whitney U test. FSC = forward scatter; NS = not significant; PE = phycoerythrin.
