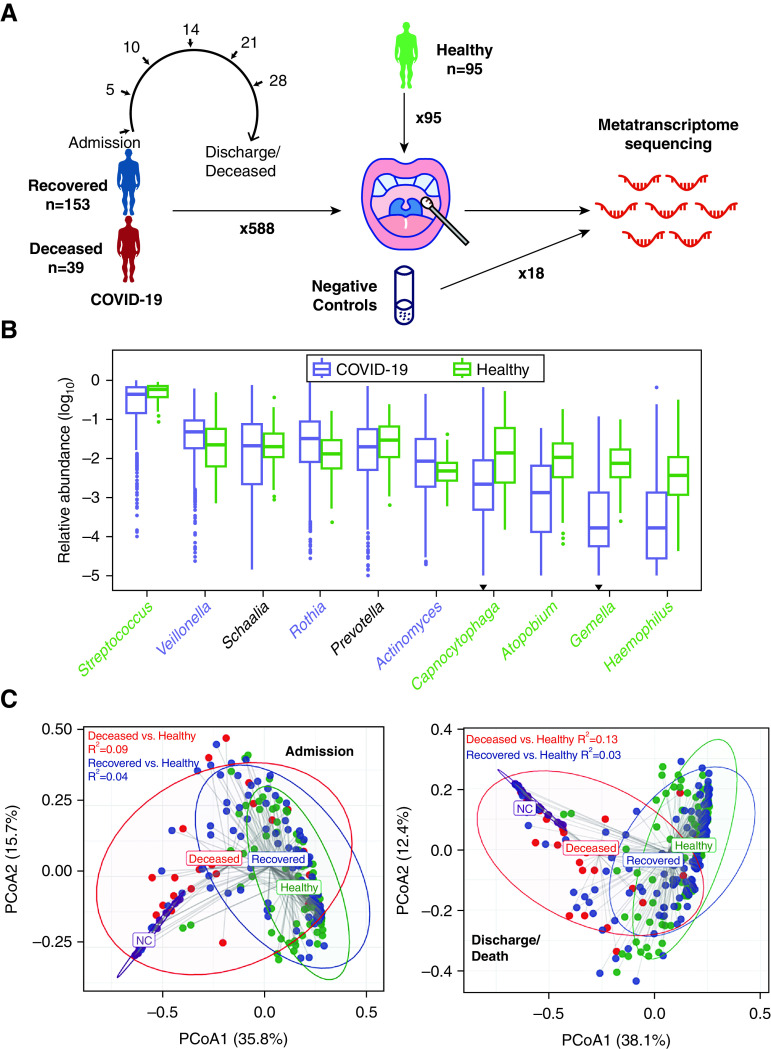
Figure 1.
Project design and overview of the upper respiratory tract microbiota. (A) The design of the study. (B) Relative abundance of the 10 most abundant genera in coronavirus disease (COVID-19) and healthy controls (HC). The genera whose abundances in both groups were not significantly higher than negative control (NC) were discarded. The genera were ordered by their abundance in COVID-19. Genera significantly enriched in patients with COVID-19 and HC were labeled in purple and green, respectively. The inverted triangle indicates the genus whose abundance was not significantly higher than that in NC. The boxes represent 25th–75th percentiles, the horizontal lines indicate the median, and the whiskers were drawn from the box to the extremes (values that were lower/greater than first/third quartile minus/plus 1.5 times the interquartile range were regarded as outliers). (C) Principal coordinate analysis plot of samples at the genus level on admission (left) and before discharge/death (right). R2 calculated by permutational multivariate ANOVA when adjusting age and sex is shown in the figure, and all P values were less than 0.001. PCoA = principal coordinate analysis.

