Figure 3.
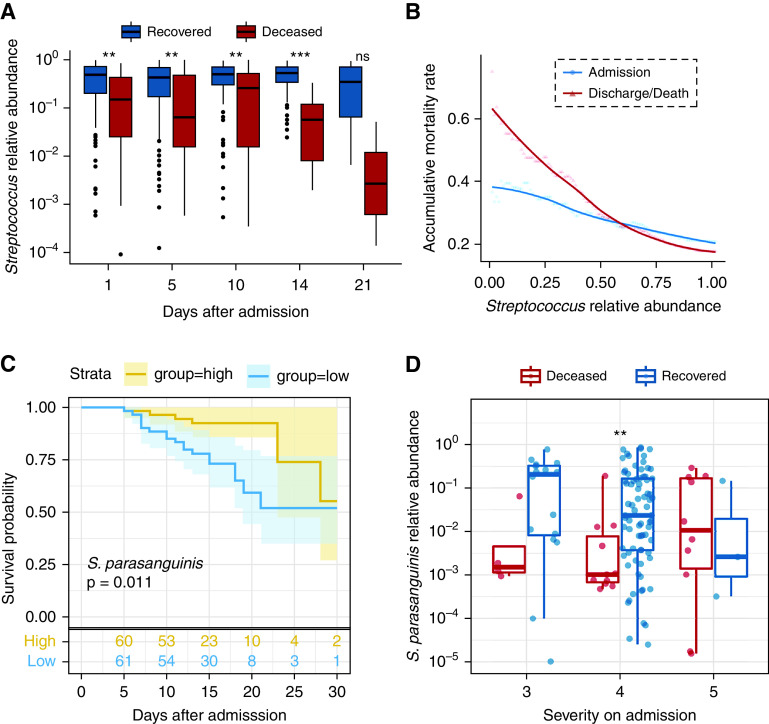
Association between the abundance of Streptococcus and mortality in patients with coronavirus disease (COVID-19). (A) The abundance of Streptococcus in recovered and deceased patients at different time points. (B) The accumulative mortality rate for individuals with different Streptococcus abundances. (C) The Kaplan-Meier curves for two groups classified by the abundance of S. parasanguinis. The cutoff to classify the patients as the high-score group and the low-score group was the median of the abundance of S. parasanguinis. The P value was calculated by log-rank test. (D) The abundance of S. parasanguinis in different severity groups. The boxes represent 25th–75th percentiles, the horizontal lines indicate the median, and the whiskers were drawn from the box to the extremes (values that were lower/greater than first/third quartile minus/plus 1.5 times the interquartile range were regarded as outliers). **P < 0.01 and ***P < 0.001. ns = not significant.

